

Incidence, severity and detection of blood pressure and heart rate perturbations in postoperative ward patients after noncardiac surgery
- PMID: 37295123
- PMCID: PMC11542488
- DOI: 10.1016/j.jclinane.2023.111159
Incidence, severity and detection of blood pressure and heart rate perturbations in postoperative ward patients after noncardiac surgery
Abstract
Study objective: We sought to determine changes in continuous mean and systolic blood pressure and heart rate in a cohort of non-cardiac surgical patients recovering on the postoperative ward. Furthermore, we estimated the proportion of vital signs changes that would remain undetected with intermittent vital signs checks.
Design: Retrospective cohort.
Setting: Post-operative general ward.
Patients: 14,623 adults recovering from non-cardiac surgical procedures.
Interventions & measurements: Using a wireless, noninvasive monitor, we recorded postoperative blood pressure and heart rate at 15-s intervals and encouraged nursing intervention as clinically indicated.
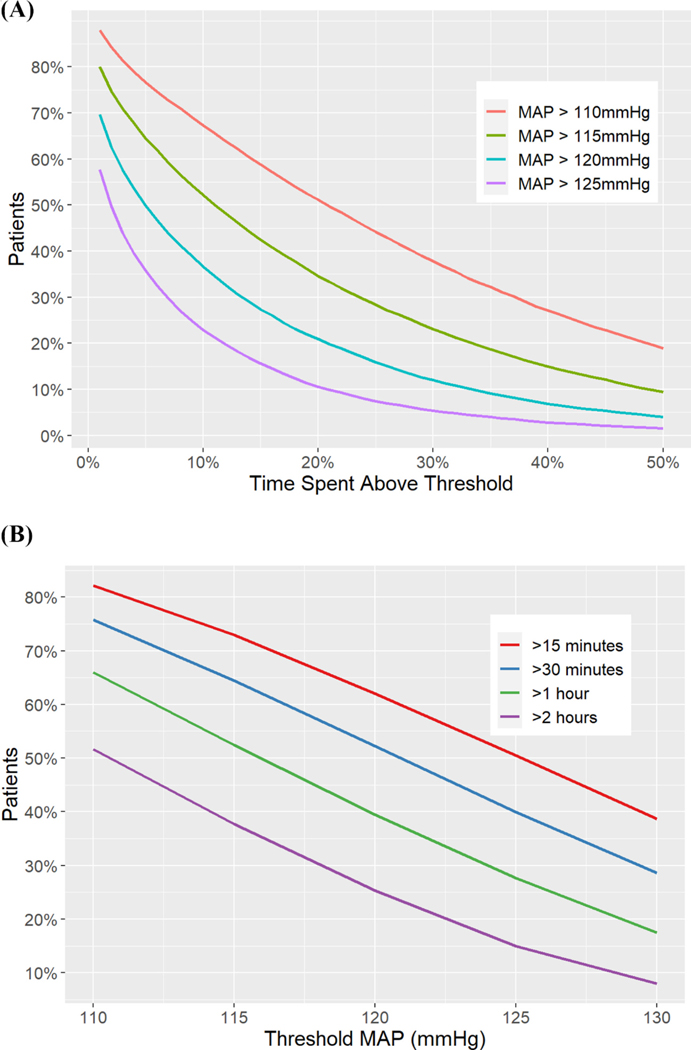
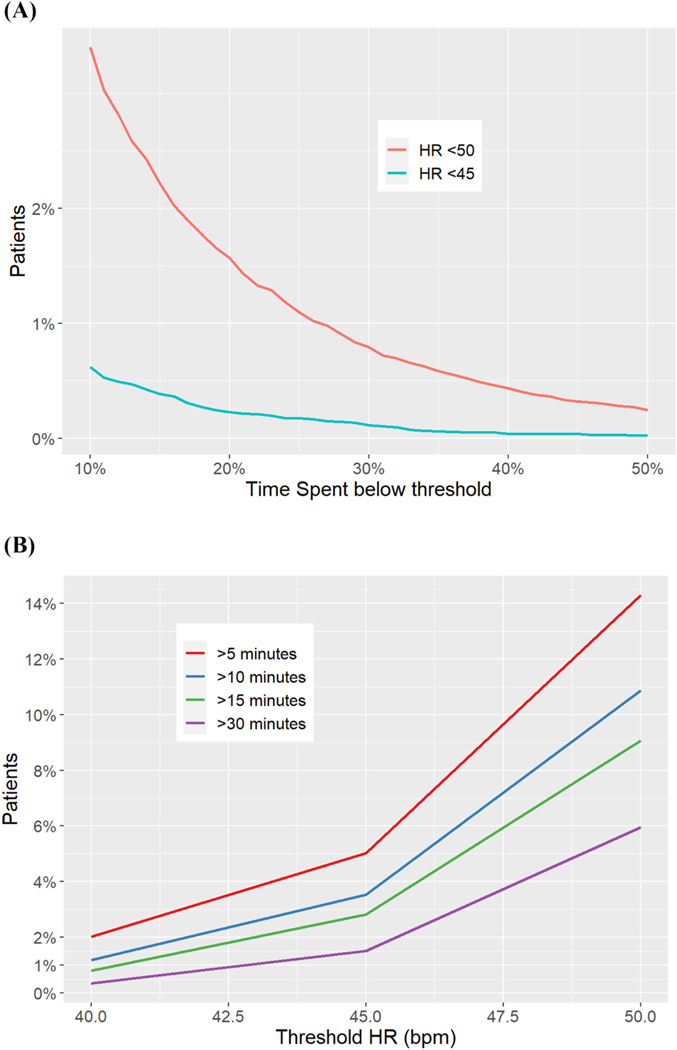
Main results: 7% of our cohort of 14,623 patients spent >15 sustained minutes with a MAP <65 mmHg, and 23% had MAP <75 mmHg for 15 sustained minutes. Hypertension was more common, with 67% of patients spending at least 60 sustained minutes with MAP >110 mmHg. Systolic pressures <90 mmHg were present for 15 sustained minutes in about a fifth of all patients, and 40% of patients had pressures >160 mmHg sustained for 30 min. 40% of patients were tachycardic with heart rates >100 beats/min for at least continuous 15 min and 15% of patients were bradycardic at a threshold of <50 beats/min for 5 sustained minutes. Conventional vital sign assessments at 4-h intervals would have missed 54% of mean pressure episodes <65 mmHg sustained >15 min, 20% of episodes of mean pressures >130 mmHg sustained >30 min, 36% of episodes of heart rate > 120 beats/min sustained <10 min, and 68% of episodes of heart rate sustained <40 beats per minute for >3 min.
Conclusions: Substantial hemodynamic disturbances persisted despite implementing continuous portable ward monitoring coupled with nursing alarms and interventions. A significant proportion of these changes would have gone undetected using traditional intermittent monitoring. Better understanding of effective responses to alarms and appropriate interventions on hospital wards remains necessary.
Keywords: Blood pressure; Continuous; Heart rate; Monitoring; Vital signs.
Copyright © 2023 Elsevier Inc. All rights reserved.
Conflict of interest statement
Declaration of Competing Interest Dr. Khanna is a consultant for Edwards Lifesciences, Caretaker Medical, Retia Medical, Philips Research North America, GE Healthcare, Baxter, and Medtronic, and is supported by an NIH/NCATS KL2 award for a pilot trial of continuous hemodynamic and oxygenation monitoring on hospital wards. The Department of Anesthesiology at Wake Forest School of Medicine is funded by Edwards Lifesciences, Masimo, and Medtronic. Dr. Sessler is a consultant for Edwards Lifesciences, Sensifree and Perceptive Medical. The Department of Outcomes Research is funded by Edwards Lifesciences, GE Healthcare, and Masimo. None of the other authors have any potential competing interests to report.
Figures


Comment in
-
Postoperative intrahospital monitoring: Transforming the danger zone.J Clin Anesth. 2024 Feb;92:111183. doi: 10.1016/j.jclinane.2023.111183. Epub 2023 Jun 14. J Clin Anesth. 2024. PMID: 37328311 No abstract available.
-
Letter to the editor regarding "Incidence, severity and detection of blood pressure and heart rate perturbations in postoperative ward patients after noncardiac surgery".J Clin Anesth. 2024 Aug;95:111446. doi: 10.1016/j.jclinane.2024.111446. Epub 2024 Mar 15. J Clin Anesth. 2024. PMID: 38492451 No abstract available.
References
-
- Lienhart A, Auroy Y, Pequignot F, Benhamou D, Warszawski J, Bovet M, et al. Survey of anesthesia-related mortality in France. Anesthesiology. 2006;105: 1087–97. - PubMed
-
- Vascular Events In Noncardiac Surgery Patients Cohort Evaluation Study I, Devereaux PJ, Chan MT, Alonso-Coello P, Walsh M, Berwanger O, et al. Association between postoperative troponin levels and 30-day mortality among patients undergoing noncardiac surgery. JAMA 2012;307:2295–304. - PubMed
-
- Kristensen SD, Knuuti J, Saraste A, Anker S, Botker HE, De Hert S, et al. 2014 ESC/ESA guidelines on non-cardiac surgery: cardiovascular assessment and management: the joint task force on non-cardiac surgery: cardiovascular assessment and management of the European Society of Cardiology (ESC) and the European Society of Anaesthesiology (ESA). Eur J Anaesthesiol 2014;31:517–73. - PubMed
Publication types
MeSH terms
Grants and funding
LinkOut - more resources
Full Text Sources
Medical
