. 2023 Aug 2;111(15):2432-2447.e13.
doi: 10.1016/j.neuron.2023.05.008. Epub 2023 Jun 8.

Mouse frontal cortex mediates additive multisensory decisions

Affiliations

Mouse frontal cortex mediates additive multisensory decisions

Philip Coen et al. Neuron. .

Abstract

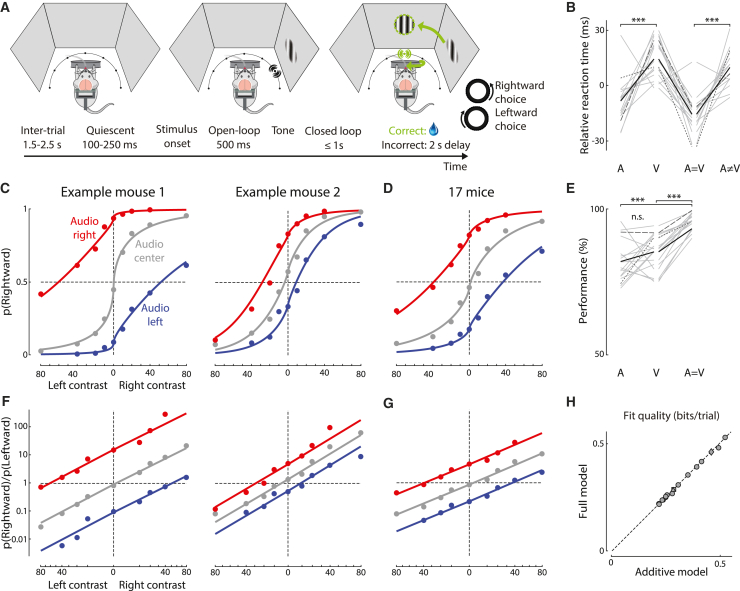
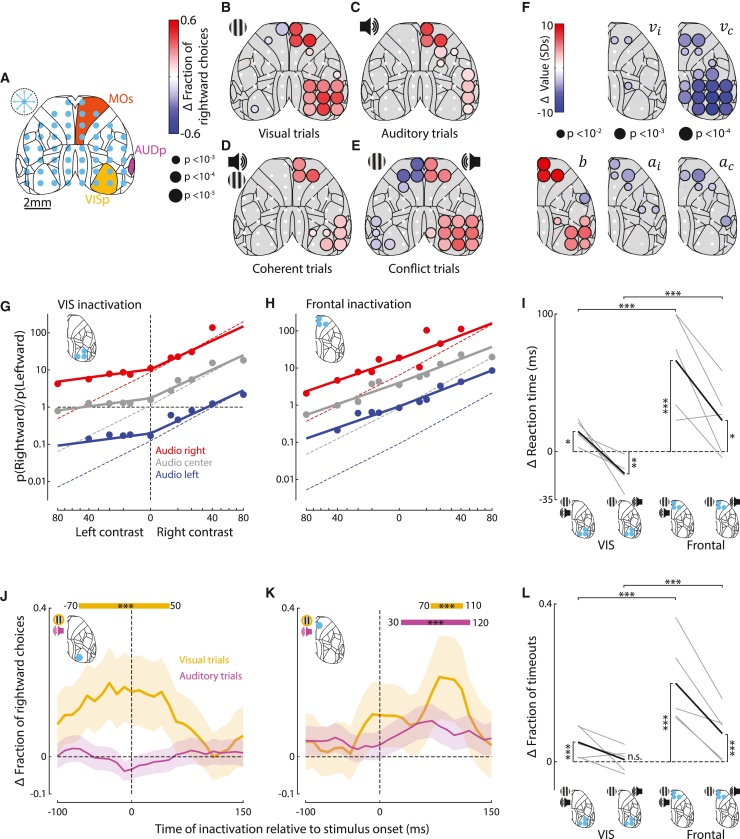
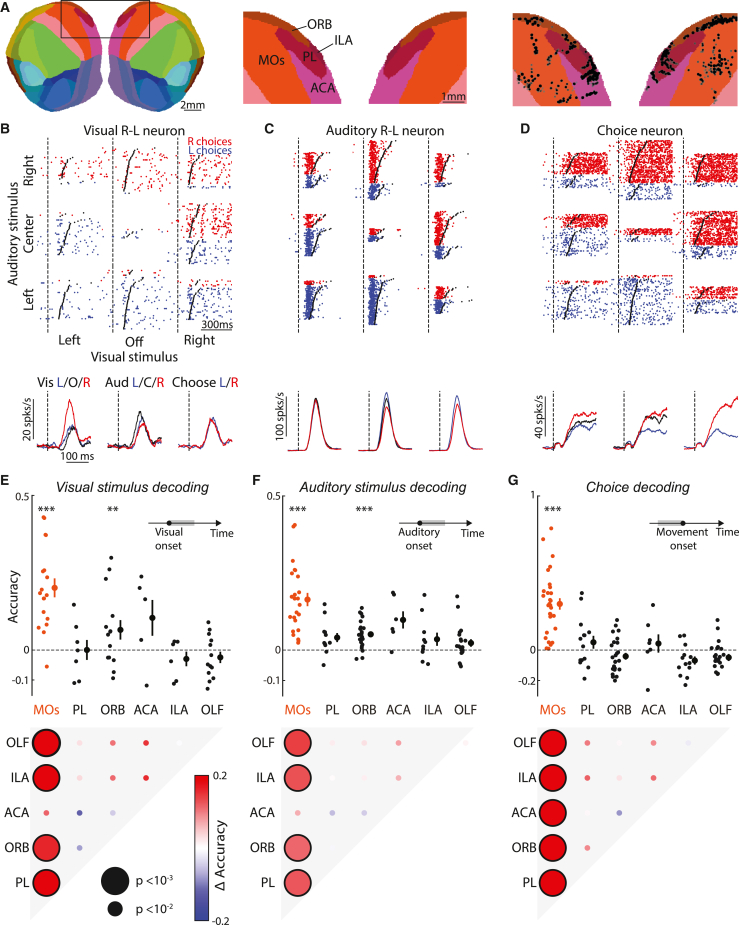
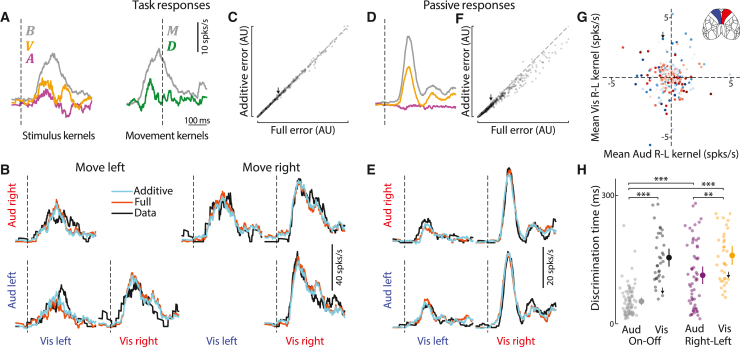
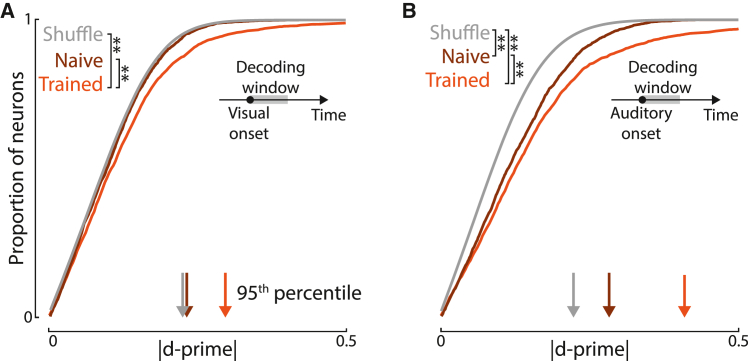
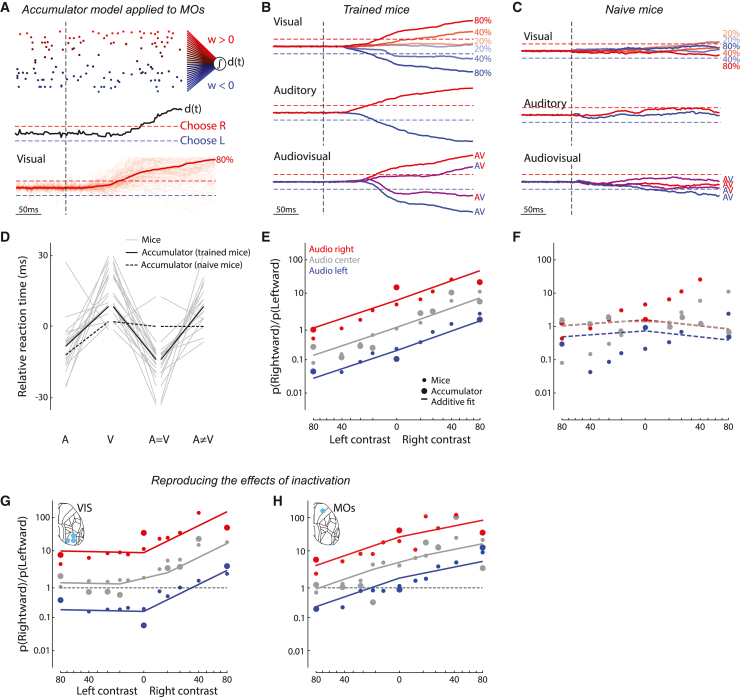
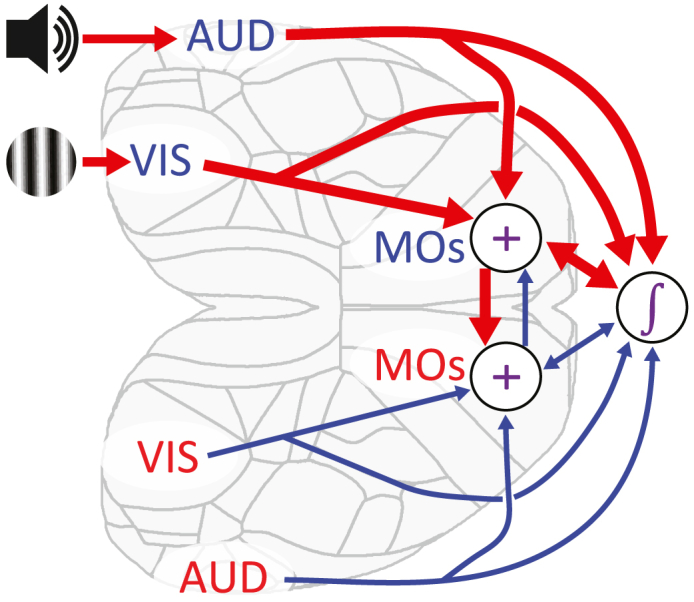
The brain can combine auditory and visual information to localize objects. However, the cortical substrates underlying audiovisual integration remain uncertain. Here, we show that mouse frontal cortex combines auditory and visual evidence; that this combination is additive, mirroring behavior; and that it evolves with learning. We trained mice in an audiovisual localization task. Inactivating frontal cortex impaired responses to either sensory modality, while inactivating visual or parietal cortex affected only visual stimuli. Recordings from >14,000 neurons indicated that after task learning, activity in the anterior part of frontal area MOs (secondary motor cortex) additively encodes visual and auditory signals, consistent with the mice's behavioral strategy. An accumulator model applied to these sensory representations reproduced the observed choices and reaction times. These results suggest that frontal cortex adapts through learning to combine evidence across sensory cortices, providing a signal that is transformed into a binary decision by a downstream accumulator.

Keywords: audiovisual; decision-making; mixed selectivity; neural coding; optogenetics; parietal cortex; prefrontal cortex; visual cortex.


Conflict of interest statement

Declaration of interests M.C. is a member of Neuron’s advisory board.

Figures

Figure 1
Figure 1
Spatial localization task reveals additive audiovisual integration (A) Behavioral task. Top: visual and auditory stimuli are presented using 3 screens and 7 speakers. In the example, auditory and visual stimuli are presented on the right, and the subject is rewarded for turning the wheel counter-clockwise to center the stimuli (a “rightward choice”). Bottom: task timeline. After inter-trial interval of 1.5–2.5 s, mice must hold the wheel still for 100–250 ms. They then have 1.5 s to indicate their choice. During the first 500 ms of this period, the stimulus does not move (“open loop”), but during the final 1 s, stimulus position is yoked to wheel movement. After training, over 90% of choices occurred during open loop (Figures S1D–S1F). (B) Median reaction times for each stimulus type, relative to mean across stimulus types. Only trials with 40% contrast were included. Gray lines: individual mice; black line: mean across 17 mice. Long and short dashes indicate example mice from left and right of (C). (C) Fraction of rightward choices at each visual contrast and auditory stimulus location for two example mice. Curves: fit of the additive model. (D) As in (C), but averaged across 17 mice (∼156,000 trials). Curves: combined fit across all mice. (E) Mouse performance (% rewarded trials) for different stimulus types (“correct” is undefined on conflict trials). Plotted as in (B). (F and G) Data from (C) and (D), replotted as odds of choosing right vs. left (in log coordinates, Y axis) as a function of visual contrast raised to the power γ. Model predictions are straight lines. (H) Log2-likelihood ratio for the additive vs. full model where each combination of visual and auditory stimuli is allowed its own behavioral response that need not follow an additive law. (5-fold cross-validation, relative to a bias-only model). Triangles and diamonds: mice from left and right of (C). Squares: combined fit across 17 mice. There is no significant difference between models (p > 0.05). ∗∗∗p < 0.001 (paired t test).
Figure 2
Figure 2
Optogenetic inactivation identifies roles of sensory and frontal cortical areas (A) Schematic of inactivation sites. On ∼75% of trials, a blue laser randomly illuminated one of 52 sites (blue dots) for 1.5 s following stimulus onset. Dashed circle: estimated radius (1 mm) of effective laser stimulation. Yellow, orange, and magenta: primary visual region (VISp), primary auditory region (AUDp), and secondary motor cortex (MOs). (B) Change in the fraction of rightward choices for each laser site for unisensory left visual stimulus trials. Red and blue dots: increases and decreases in fraction of rightward choices; dot size represents statistical significance (5 mice, shuffle test, see STAR Methods). Data for right stimulus trials were included after reflecting the maps (see Figure S4A for both individually). (C) As in (B), but for unisensory auditory trials. (D) As in (B), but for coherent multisensory trials. (E) As in (B), but for conflict multisensory trials. (F) As in (B)–(E), but dot color indicates the change in parameters of the additive model. b, bias toward ipsilateral choices (relative to inactivation site); vi and vc, sensitivity to ipsilateral and contralateral contrast; ai and ac, sensitivity to ipsilateral and contralateral auditory stimuli. (G) Fit of additive model to trials when a site in visual cortex was inactivated. Dashed lines: model fit to non-inactivation trials. Trials with inactivation of left visual cortex were included after reflecting the maps (5 mice, 6,497 trials). Inactivation significantly changed model parameters (paired t test, p < 0.05). (H) As in (G), but for trials when frontal cortex was inactivated (5 mice, 5,612 trials). Inactivation significantly changed model parameters (paired t test, p < 0.05). (I) Change in multisensory reaction times when visual or frontal cortex was inactivated contralateral to the visual stimulus. Gray and black lines: individual mice (n = 5) and the mean across mice. Reaction times are the mean across the medians for each contrast relative to non-inactivation trials. Values above 100 ms were truncated for visualization. On coherent trials, inactivating visual or frontal cortex increased reaction time, with larger effect for frontal. On conflict trials, inactivation of visual cortex decreased reaction time while inactivation of frontal cortex caused an increase. p < 0.05, ∗∗p < 0.01, p < 0.001 (linear mixed-effects model). (J) Change in fraction of rightward choices when contralateral visual cortex was inactivated on visual (yellow, 519 trials) or auditory (magenta, 1,205 trials) trials. Inactivation was a 25 ms, 25 mW laser pulse at different time points. Curves show average over mice smoothed with a 70 ms boxcar window. Shaded areas: 95% binomial confidence intervals. ∗∗∗ indicates intervals where fraction of rightward choices differs significantly from controls (p < 0.001, Fisher’s exact test). (K) As in (J), but for frontal inactivation (451 and 1,291 trials for auditory and visual conditions). (L) As in (I), but for the change in the fraction of timeout trials. On coherent trials, inactivation of either visual or frontal cortex significantly increased timeouts. On conflict trials, only frontal inactivation changed the fraction of timeouts. ∗∗∗p < 0.001 (linear mixed-effects model).
Figure 3
Figure 3
Neurons in frontal area MOs encode stimuli and predict behavior (A) Recording locations for cells (black dots, right) overlaid on a flattened cortical map (using the Allen Common Coordinate Framework67), showing locations in secondary motor cortex (MOs, 3,041 neurons), orbitofrontal (ORB, 5,112), anterior cingulate (ACA, 727), prelimbic (PL, 1,332) and infralimbic (ILA, 1,254) areas. (B) Top: spike rasters, separated by trial condition, from a neuron sensitive to visual spatial location (dʹ = 1.85). Red/blue rasters: trials with a rightward/leftward mouse choice. Dashed line and black points: stimulus onset and movement initiation. Bottom: peri-stimulus time histogram (PSTH) of the neural response, averaged across different visual (left), auditory (center), or choice (right) conditions. Trials are not balanced; choice and stimulus location are correlated. (C) As in (B), for a neuron sensitive to auditory spatial location (dʹ = −0.81). (D) As in (B), for a neuron sensitive to the animal’s choice (dʹ = 2.61). (E) Top: cross-validated accuracy (relative to a bias model, see STAR Methods) of a support vector machine decoder trained to predict visual stimulus location from population spiking activity time-averaged from 0 ms to 300 ms after stimulus onset. Accuracies 0 and 1 represent chance and optimal performance. Points: decoding accuracy from neurons in regions labeled in (A), or olfactory areas (OLF, 2,068 neurons), for one experimental session. Neurons were subsampled to equalize numbers across points. ∗∗∗p < 0.001, ∗∗p < 0.01 (5 sessions from 2 to 5 mice for each region, one-sided t test). Bottom: inter-regional comparison of decoding accuracy (linear mixed-effects model). Black outlines: statistically significant difference. Dot size: significance level. (F) As in (E), for decoding of auditory stimulus location (6 sessions, 3–6 mice). (G) As in (E), for decoding choices from spiking activity 0–130 ms preceding movement (7 sessions, 3–6 mice).
Figure 4
Figure 4
Frontal area MOs encodes task variables additively (A) Kernels from fitting the additive neural model to an example neuron. Dashed lines: stimulus onset (left) or movement onset (right). B, mean stimulus response; A and V, additive effects of auditory and visual stimulus location; M, mean effect of movement (relative to τi, movement onset time on trial i); D, differential effect of movement direction (right minus left). The non-additive kernel N was set to 0. (B) Cross-validated model fits to average neural activity in audiovisual conditions for the neuron from (A). Coherent trials with incorrect responses were too rare to include. Cyan and orange lines: predictions of additive (N=0) and full models. Black line: test-set average responses. Dashed lines: stimulus onset. (C) Prediction error (see STAR Methods) across all neurons for additive and full models. Arrow indicates example cell from (A and B). The additive model has a smaller error (p = 0.037, linear mixed-effects model, 2,183 cells, 5 mice). Top 1% of errors were excluded for visualization, but not analyses. (D–F) As in (A)–(C), but for neural activity during passive stimulus presentation, using only sensory kernels. In (F), p < 10−10 (2,509 cells, 5 mice, linear mixed-effects model). (G) Encoding of visual vs. auditory stimulus preference (time-averaged kernel amplitude for V vs. A) for each cell. There was no significant correlation between V and A. p > 0.05 (2,509 cells, Pearson correlation test). Red/blue: cells recorded in right/left hemisphere. Color saturation: fraction of variance explained by sensory kernels. (H) Discrimination time (see STAR Methods) relative to stimulus onset during passive conditions. Auditory Right-Left neurons (magenta, n = 59) discriminated stimulus location earlier than Visual Right-Left neurons (gold, n = 36). Auditory On-Off neurons (sensitive to presence, but not necessarily location, gray, n = 82) discriminated earliest, even compared to Visual On-Off neurons (n = 36, black). Points: individual neurons. Bars: standard error. ∗∗p < 0.01, ∗∗∗p < 0.001 (Mann–Whitney U test).
Figure 5
Figure 5
Audiovisual integration in MOs develops through learning (A) Cumulative histogram of absolute visual discriminability index (dʹ) scores for MOs neurons in naive mice (n = 2,700), trained mice (n = 2,956), and shuffled data. Training enriches the proportion of spatially sensitive neurons (∗∗p < 0.01, Welch’s t test). Naive mouse data was not significantly distinct from shuffled (p > 0.05, Welch’s t test). Arrows: 95th percentile for each category. (B) As in (A), but for auditory stimuli. Training enriches the proportion of spatially sensitive neurons, although naive mouse data was significantly distinct from shuffled data (∗∗p <0.01, Welch’s t test, n = 2,698/2,946 neurons for naive/trained mice).
Figure 6
Figure 6
An accumulator applied to MOs activity in trained mice reproduced decisions (A) Top: population spike train rasters for a single trial, colored according to the fitted weight for that neuron. Red and blue neurons push the decision variable, dt, toward the rightward or leftward decision boundary. Vertical dashed line: stimulus onset. Population activity was created from passive recording sessions in MOs of trained mice. Middle: evolution of the decision variable over this trial. Red/blue dashed lines: rightward/leftward decision boundaries. Bottom: decision variable trajectory for individual unisensory visual trials with 80% rightward contrast (thin) and their mean (thick). (B) Mean decision variable trajectory for visual-only (top), auditory-only (middle), and multisensory (bottom) stimulus conditions. (C) As in (B), but for naive mice. (D) Median reaction times for different stimulus types, relative to mean across stimulus types, for mouse behavior (gray, n = 17; cf. Figure 1B) and the accumulator model fit to MOs activity in trained and naive mice (solid and dashed black lines). (E) Mean behavior of the accumulator with input spikes from trained mice (large circles). Small circles represent mouse performance (n = 17; cf. Figure 1G). Solid lines: fit of the additive model to the accumulator model output. The accumulator model fits mouse behavior better than shuffled data (p < 0.01, shuffle test, see STAR Methods). (F) As in (E), but for accumulator with input spikes from naive mice. There is no significant difference between the accumulator model and shuffled data (p > 0.05). (G) Simulation of right visual cortex inactivation, plotted as in (E). Activity of visual-left-preferring cells was reduced by 60%. Small circles: mean behavior from visual-cortex-inactivated mice (5 mice; cf. Figure 2G). The accumulator model fits mouse behavior better than shuffled data (p < 0.01). (H) Simulation of right MOs inactivation, plotted as in (E). Activities of neurons in left and right hemispheres were constrained to have positive and negative weights, and right-hemisphere activity was reduced by 60% before fitting. Small circles: mean behavior from MOs-inactivated mice (5 mice, small circles; cf. Figure 2H). The accumulator model fits mouse behavior better than shuffled data (p < 0.01).
Figure 7
Figure 7
Diagram of hypothesized audiovisual integration pathway through cortex Our data suggest that visual and auditory unisensory information are conveyed via visual (VIS) and auditory (AUD) sensory cortices to MOs, where a bilateral representation results from interhemispheric connections. A downstream integrator, distributed over multiple brain regions, possibly including MOs itself, accumulates MOs activity, with a biased sampling of neurons responding to contralateral stimuli. An appropriate action is then determined by an integration to bound mechanism. Alternative pathways from visual and auditory cortices appear to be able to compensate for the absence of MOs activity (e.g., during bilateral inactivation).

References

    1. Gold J.I., Shadlen M.N. Banburismus and the Brain Decoding the Relationship between Sensory Stimuli, Decisions, and Reward. Neuron. 2002;36:299–308. doi: 10.1016/s0896-6273(02)00971-6. - DOI - PubMed
    1. Ma W.J., Beck J.M., Latham P.E., Pouget A. Bayesian inference with probabilistic population codes. Nat. Neurosci. 2006;9:1432–1438. doi: 10.1038/nn1790. - DOI - PubMed
    1. Ernst M.O., Banks M.S. Humans integrate visual and haptic information in a statistically optimal fashion. Nature. 2002;415:429–433. doi: 10.1038/415429a. - DOI - PubMed
    1. Angelaki D.E., Gu Y., DeAngelis G.C. Multisensory integration: psychophysics, neurophysiology, and computation. Curr. Opin. Neurobiol. 2009;19:452–458. doi: 10.1016/j.conb.2009.06.008. - DOI - PMC - PubMed
    1. Chandrasekaran C. Computational principles and models of multisensory integration. Curr. Opin. Neurobiol. 2017;43:25–34. doi: 10.1016/j.conb.2016.11.002. - DOI - PMC - PubMed

Publication types

LinkOut - more resources