. 2023 Jun 19;33(12):2515-2527.e6.
doi: 10.1016/j.cub.2023.05.047. Epub 2023 Jun 8.

Dynamics of eastern equine encephalitis virus during the 2019 outbreak in the Northeast United States

Affiliations

Dynamics of eastern equine encephalitis virus during the 2019 outbreak in the Northeast United States

Verity Hill et al. Curr Biol. .

Abstract

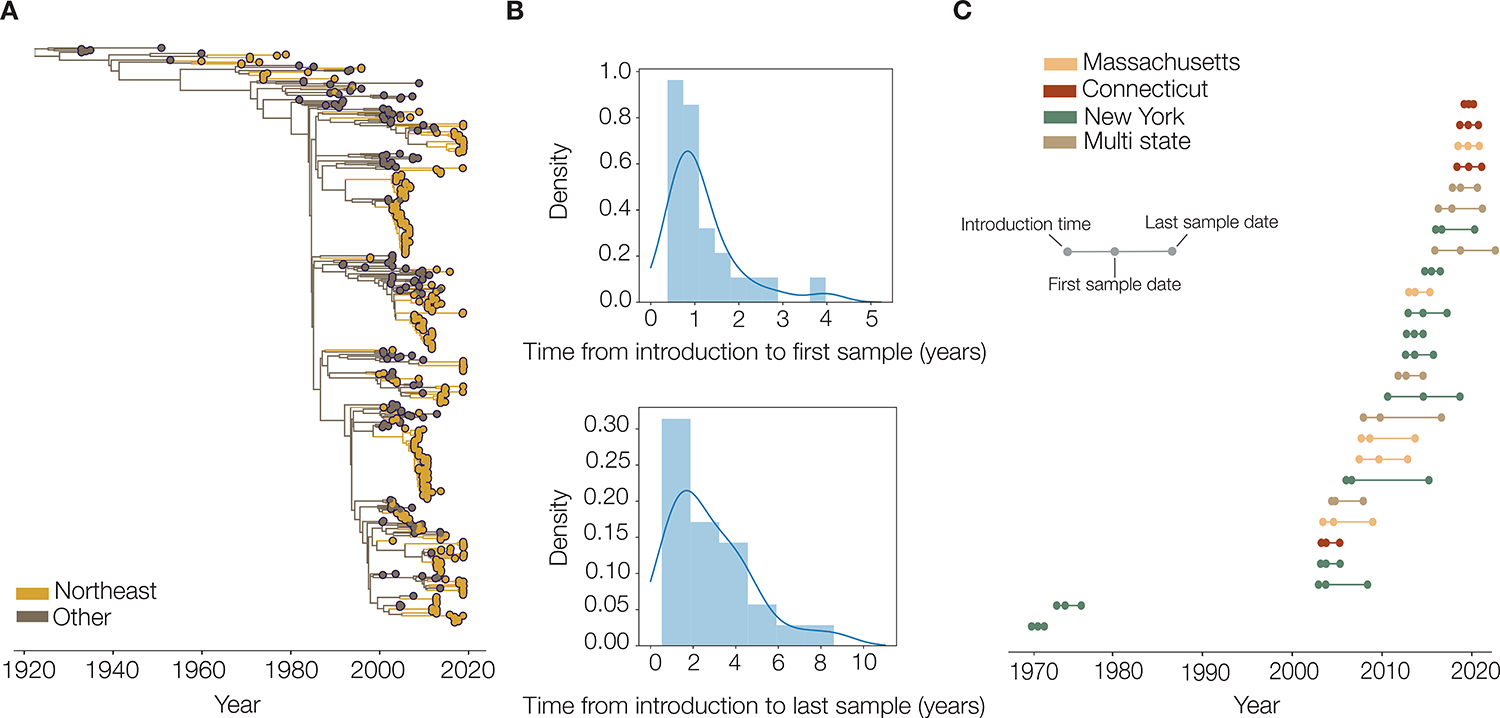
Eastern equine encephalitis virus (EEEV) causes a rare but severe disease in horses and humans and is maintained in an enzootic transmission cycle between songbirds and Culiseta melanura mosquitoes. In 2019, the largest EEEV outbreak in the United States for more than 50 years occurred, centered in the Northeast. To explore the dynamics of the outbreak, we sequenced 80 isolates of EEEV and combined them with existing genomic data. We found that, similar to previous years, cases were driven by multiple independent but short-lived virus introductions into the Northeast from Florida. Once in the Northeast, we found that Massachusetts was important for regional spread. We found no evidence of any changes in viral, human, or bird factors which would explain the increase in cases in 2019, although the ecology of EEEV is complex and further data is required to explore these in more detail. By using detailed mosquito surveillance data collected by Massachusetts and Connecticut, however, we found that the abundance of Cs. melanura was exceptionally high in 2019, as was the EEEV infection rate. We employed these mosquito data to build a negative binomial regression model and applied it to estimate early season risks of human or horse cases. We found that the month of first detection of EEEV in mosquito surveillance data and vector index (abundance multiplied by infection rate) were predictive of cases later in the season. We therefore highlight the importance of mosquito surveillance programs as an integral part of public health and disease control.

Keywords: Northeastern USA; eastern equine encephalitis; mosquito modeling; outbreak prediction; phylodynamics; virus evolution.


Conflict of interest statement

Declaration of interests The authors declare no conflicts of interest related to this work.

Figures

Figure 1 |
Figure 1 |. Temporal and geographical characteristics of previous EEEV outbreaks after 2000 and context of the 2019 outbreak in Massachusetts, Connecticut, and New York.
A) Human and horse cases per year since 2000 in Massachusetts, Connecticut, and New York, colored by state. B) Human and veterinary cases in 2019 in these three states by sample date. Note that human cases are only available to the nearest month whereas veterinary cases have specific dates. C) Map showing geographical distribution of human and horse cases in 2019, shown as stars, relative to EEEV detections after 2000 in Massachusetts, Connecticut, and New York. Brown denotes counties where mosquito-positive pools have been sampled, hatched are non-human cases, and circles are human cases. D) EEEV infection rate of Culiseta melanura mosquitoes and the number tested in Massachusetts, Connecticut, and New York by year from 2000. Also see Figure S2.
Figure 2 |
Figure 2 |. Phylogeographic reconstruction of EEEV from 2019 and prior outbreaks
A) Number of EEEV sequences in the dataset over time by year of sampling. Note that the nationwide reporting of surveillance data began in 2003. B) Location of EEEV sequences in the dataset from Massachusetts, New York, and Connecticut to the county level. Stars indicate the location of EEEV samples which were newly sequenced for this study. C) Location of all EEEV sequences in the study to state level. D) Time-resolved phylogeny colored by location of nodes from the discrete phylogeographic analysis. States in the Northeast are colored separately, but non-Northeast and non-Florida states are grouped together. Larger tips represent EEEV sequences from 2019. E) Movement of virus from the full posterior of the discrete phylogeographic analysis. Direction is counterclockwise, and width of lines corresponds to frequency of movement across the posterior. Movements that make up fewer than 1% of the total posterior have been filtered out. Also see Figure S1 and Table S1.
Figure 3 |
Figure 3 |. Detection and persistence of EEEV lineages in the Northeast
A) Time-scaled phylogeny estimating EEEV introductions into the Northeast, taking sporadic sampling into account by splitting up clusters with very long internal branches (see Methods). B) Distributions of time from introduction to first (top) and last sample (bottom) for Northeastern clusters of more than three EEEV sequences. C) Time of first node in the Northeast, first sample, and last sample for each cluster with more than three EEEV sequences, colored by state.
Figure 4 |
Figure 4 |. Phylogeographic spread of EEEV within the Northeast
A) Between-state movements from the maximum clade credibility (MCC) tree of the phylogeographic analysis within the six Northeastern EEEV clusters which have between-state movement. Width of lines relates to the number of movements, and direction is counter-clockwise. B) Maps showing sampling location to the county level for each EEEV cluster with multiple states where available. Stars indicate where there are sequences with information only at the state level (n=2 in New Hampshire, n=1 in Massachusetts and n=3 in Vermont). Corresponding subtrees are shown to the right of each map, colored by inferred location to the state level.
Figure 5 |
Figure 5 |. Model predictions of EEEV cases using mosquito infection estimates
A) Poisson regression by state of the number of EEEV positive Cs. melanura pools sampled and human and horse cases. B) Monthly trends across the year of mosquito abundance (Cs. melanura collected per trap per day), infection rate (MLE per 1000 Cs. melanura), vector index (abundance multiplied by the infection rate) and index P (modeled estimate of reproduction number), for Connecticut and Massachusetts. 2019 values are highlighted in red. C) Results of a negative binomial regression model for both Connecticut and Massachusetts combined of case risk predicted by vector index, first month of EEEV detection, index P with a 1 month lag, year, and risk compared to the month of May-July of cases in August, September, and October. The covariate for state was removed for scale, as its estimate is 11.95 (95% CI: 3.88 to 43.70) with Connecticut being the reference group. D) Actual and predicted case counts for each year based on the modeled results presented in C. Shaded areas denote error in the predicted values. E) Simulations using the previously described model. Predicted cases and intervals utilized a range of plausible vector index values and whether EEEV was detected in July or not, with index P held constant using the average value derived from the years studied for each month; and split by state. Shaded areas represent 95% confidence intervals and points are real data points from the EEEV mosquito surveillance program discussed elsewhere. Stars indicate values from 2019 and darker points indicate the actual modeled value of Index P. This model underpredicts cases when the vector index is low, as the real data points fall outside of the prediction intervals, indicating a potential lag in identification of EEEV cases. This could be due in part to stochastic chance in surveillance programs missing EEEV with low levels of virus circulation. As the vector index increases, however, our predicted values become closer to the observed data points. See also figures S3, S4, and S5, and tables S2, S3 and S4.

Update of

References

    1. Giltner, and Shahan (1933). The 1933 outbreak of infectious equine encephalomyelitis in the eastern states. North Am. Vet.
    1. TenBroeck C, and Merrill MH (1933). A serological difference between eastern and western equine encephalomyelitis virus. Proc. Soc. Exp. Biol. Med. 31.
    1. Lindsey NP, Erin Staples J, and Fischer M (2018). Eastern Equine Encephalitis Virus in the United States, 2003–2016. Am. J. Trop. Med. Hyg. 98, 1472. - PMC - PubMed
    1. Lindsey NP, Martin SW, Staples JE, and Fischer M (2020). Notes from the Field: Multistate Outbreak of Eastern Equine Encephalitis Virus - United States, 2019. MMWR Morb. Mortal. Wkly. Rep. 69, 50–51. - PMC - PubMed
    1. Shamus KJ (2019). Deaths from mosquito-borne EEE virus prompt calls to cancel outdoor events in Michigan. USA Today.

Publication types