. 2023 Jul 6;83(13):2290-2302.e13.
doi: 10.1016/j.molcel.2023.05.020. Epub 2023 Jun 8.

Mechanism of ribosome-associated mRNA degradation during tubulin autoregulation

Affiliations

Mechanism of ribosome-associated mRNA degradation during tubulin autoregulation

Markus Höpfler et al. Mol Cell. .

Abstract

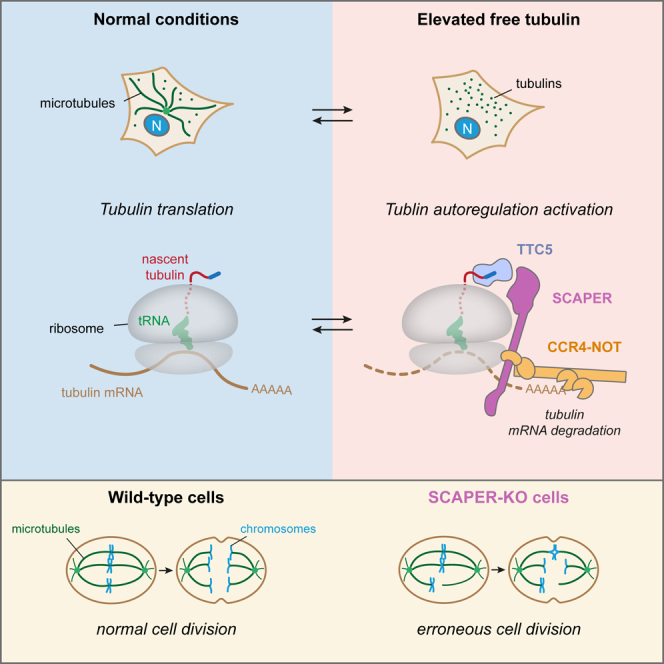
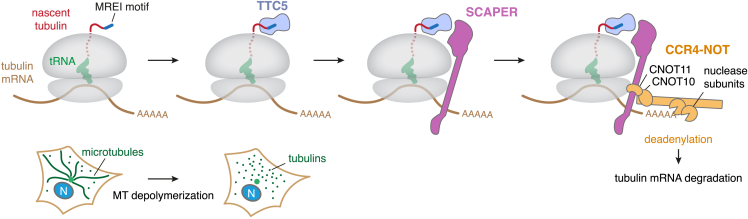
Microtubules play crucial roles in cellular architecture, intracellular transport, and mitosis. The availability of free tubulin subunits affects polymerization dynamics and microtubule function. When cells sense excess free tubulin, they trigger degradation of the encoding mRNAs, which requires recognition of the nascent polypeptide by the tubulin-specific ribosome-binding factor TTC5. How TTC5 initiates the decay of tubulin mRNAs is unknown. Here, our biochemical and structural analysis reveals that TTC5 recruits the poorly studied protein SCAPER to the ribosome. SCAPER, in turn, engages the CCR4-NOT deadenylase complex through its CNOT11 subunit to trigger tubulin mRNA decay. SCAPER mutants that cause intellectual disability and retinitis pigmentosa in humans are impaired in CCR4-NOT recruitment, tubulin mRNA degradation, and microtubule-dependent chromosome segregation. Our findings demonstrate how recognition of a nascent polypeptide on the ribosome is physically linked to mRNA decay factors via a relay of protein-protein interactions, providing a paradigm for specificity in cytoplasmic gene regulation.

Keywords: CCR4-NOT complex; RNA degradation; co-translational regulation; microtubules; ribosome; tubulin.


Conflict of interest statement

Declaration of interests L.A.P. is an inventor on a patent filed by the Medical Research Council for all-gold EM supports, licensed to Quantifoil under the trademark UltrAuFoil. L.A.P. and R.S.H. are on the advisory board for Molecular Cell.

Figures

None
Graphical abstract
Figure 1
Figure 1
TTC5 proximity labeling identifies SCAPER as autoregulation-specific interactor (A) Strategy for identification of tubulin autoregulation factors acting downstream of TTC5 on tubulin-translating ribosomes. Proximity labeling was achieved by fusing TurboID to the N terminus of either wild-type (WT) TTC5 or the Lys97 → Ala (K97A) mutant. (B) Quantification of tubulin mRNA in HEK293 T-REx cells by reverse transcription followed by quantitative real-time PCR. TUBA1B mRNA levels were normalized to a house-keeping gene (RPLP1) and the relative amount remaining after 3 h 10 μM colchicine (colch.) treatment is plotted. This is hereafter referred to as the “autoregulation assay.” The red dashed line indicates the starting tubulin mRNA level prior to colchicine, arbitrarily set to a value of 1. The black dashed line indicates the amount remaining in WT cells. This is typically ∼0.5 after 3 h of colchicine, reflective of 50% mRNA degradation, but varies slightly in different experiments due to minor variations in experimental conditions. TTC5 knockout (KO) was complemented by re-expressing GFP-tagged WT or K97A TTC5. Data show the mean from 2 independent experiments, one of which contained 2 replicates for the TTC5 K97A cell line. Error bars denote standard deviation (SD). The lack of TUBA1B mRNA degradation in the K97A cell line relative to WT cells was statistically significant (asterisk, p = 0.014, Student’s t test). (C) Proximity labeling using TurboID fused to either WT or mutant (K97A) TTC5 followed by enrichment of biotinylated proteins and quantitative mass spectrometry. 6 samples were analyzed for TurboID-TTC5 WT and K97A. See also Table S2. (D) Proximity labeling assay as in (C) with overexpression of FLAG-tagged SCAPER in the indicated cell lines. Total lysates were probed with anti-FLAG antibody and the biotinylated population with anti-SCAPER antibody. Endogenous SCAPER is not detected at this exposure due to its low expression. HEK293 T-REx cells were used for all cell-based assays in this study, unless stated otherwise (Figures 6 and S9). See also Figure S1.
Figure 2
Figure 2
TTC5 recruits SCAPER to tubulin ribosome-nascent-chain complexes for autoregulation (A) Recombinant Strep-TTC5 and SCAPER-FLAG were incubated together and pulled down via Strep-TTC5. Bound proteins were separated using SDS-PAGE and visualized by Coomassie staining. (B) Schematic workflow for reconstitution of SCAPER recruitment to tubulin ribosome nascent chains (RNCs) via TTC5 as shown in (C). (C) 64-residue β-tubulin (TUBB) nascent chains were produced in rabbit reticulocyte lysates in the presence of recombinant FLAG-SCAPER (all samples) and Strep-TTC5 as indicated, and TTC5-associated proteins were subsequently enriched via its Strep tag. Input and Strep-TTC5 pull-down samples were separated by SDS-PAGE and visualized by western blotting, autoradiography for the β-tubulin nascent chain (Tub. NC), or SYPRO Ruby staining for total protein. “MHQV” indicates a β-tubulin construct in which its TTC5-interacting MREI motif has been mutated. (D) Top: schematic of SCAPER domain architecture, including annotated features and predicted structural elements. The pathologic ΔE620 mutation is indicated by a red arrowhead (see also Figure S4A). RSL, cyclin A-binding motif (Arg199-Ser200-Leu201); ZnF, zinc finger; CTD, carboxy-terminal domain. Bottom: autoregulation assay with HEK T-REx wild type, SCAPER-KO (sgRNA1 cl. 1), and the indicated FLAG-SCAPER rescue cell lines. RSL-AAA: mutation of the cyclin A-binding site (Arg199-Ser200-Leu201) to alanines; Δ2–350: deletion of residues 2–350; ΔE620: deletion of residue Glu620. Data show the mean ± SD from 2 independent experiments, one of which contained 2 replicates. Single asterisk indicates p < 0.05, triple asterisk indicates p < 0.001, and “ns” indicates not significant. See Figures S3B–S3D for a detailed analysis of SCAPER-KO cell lines. The same SCAPER-KO cell line (sgRNA1 clone 1) was used for complementation assays throughout the rest of the study. See also Figures S2–S4.
Figure 3
Figure 3
Mechanism of SCAPER recruitment to tubulin RNCs via TTC5 (A) Overview of the cryo-EM-derived structure of β-tubulin-synthesizing ribosomes bound to TTC5 and SCAPER. Dashed arrow marks density that was identified as 28S rRNA expansion segment ES27L. Boxes indicate positions of close-ups shown in (B)–(D). The displayed non-sharpened map resulted from the ES27L classification (see Figure S5). The 40S subunit was rigid-body docked and is shown to orient the reader. (B) Close-up view of the contact between SCAPER and TTC5. SCAPER is colored by electrostatic surface potential [in kcal/(mol e)], and the surface area of critical residues is outlined. (C) Close-up view of critical positively charged SCAPER residues in close vicinity to 28S rRNA. (D) Close-up view of conserved arginine residues of SCAPER in close proximity to aspartate residues of ribosomal protein uL23. (E) Autoregulation assay comparing WT, SCAPER-KO, and rescue cell lines expressing the indicated SCAPER mutants. EMS-AAA: E1338A, M1339A, S1340A; RK-EE: R907E, K910E; RR-AA: R934A, R941A. Data show the mean ± SD from 2 independent experiments, one of which contained 2 replicates. (F) Autoregulation assay as in (E) with mutations in the ES27L contact site of SCAPER. ES-4E: K867E, K870E, K873E and K874E; ES-7E: as ES-4E plus K869E, K871E and R878E. See also Figure S6. Data show the mean from 2 independent experiments, one of which contained 2 replicates for each of the key mutants. Error bars denote SD. Single, double, and triple asterisks indicate p < 0.05, p < 0.01, and p < 0.001, respectively. See also Figures S5 and S6 and Table S1.
Figure 4
Figure 4
The CCR4-NOT complex triggers tubulin mRNA degradation (A) Schematic for the strategy to identify factors acting downstream of SCAPER to degrade tubulin mRNA. (B) Proximity labeling in HEK T-REx cells using TurboID fusions to either SCAPER WT or the ΔE620 mutant, performed after induction of autoregulation with the microtubule depolymerization agent combretastatin A4 (CA4, at 100 nM). Biotinylated proteins were enriched and analyzed by quantitative mass spectrometry. See also Table S3. 3 replicate samples were analyzed for SCAPER WT, and 2 replicates for ΔE620. (C) Schematic of the subunit composition of the CCR4-NOT complex. (D) Autoregulation assay performed after knockdowns (KD) using control, TTC5- or CNOT1-targeted siRNAs. Data show the mean from 2 independent experiments, one of which contained 2 replicates for CNOT1 siRNAs. Error bars denote SD. (E) Autoregulation assays performed after control KD, or KD of all partially redundant catalytic deadenylase subunits of CCR4-NOT (siRNAs 6/6L/7/8). CNOT8 expression was accomplished by stable integration of siRNA-resistant CNOT8-WT (blue bars) or the catalytic dead D40A mutant (CNOT8-CD, red bars). Data show the mean ± SD from 2 independent experiments, one of which contained 2 replicates. Single, double, and triple asterisks indicate p < 0.05, p < 0.01, and p < 0.001, respectively; “ns” indicates not significant. (F) Poly(A) tail-length assays were performed on total RNA isolated from the indicated HEK T-REx cell lines in control conditions or after 3 h 100 nM CA4 treatment to induce tubulin autoregulation. Total mRNAs were modified at their 3′ ends with a guanosine/inosine tail (G/I tail), reverse transcribed, and PCR amplified using a gene-specific forward primer to either TUBA1B (left) or GAPDH (right) and universal reverse primer. Size markers for PCR products lacking a poly(A) tail were generated using gene-specific reverse primers that anneal in the 3′ UTRs ∼70 nt upstream of the poly(A)-site (first lane of each gel, marked by triangles). PCR products were separated on agarose gels and inverted images are shown. Diagram depicts the PCR strategy and positions of primers. See also Figure S7.
Figure 5
Figure 5
SCAPER recruits the CCR4-NOT complex via CNOT11 (A) Autoregulation assays were performed after KD using the indicated siRNAs for 3–4 days. We note that KD of PAN2 did not lead to stabilization of tubulin mRNAs in autoregulation assays. PAN2 is the catalytic subunit of the PAN2-PAN3 complex that often initiates deadenylation before CCR4-NOT. Data show the mean ± SD from 3 independent experiments. One sample for siPAN2 #1 was lost. Significant changes from the siRNA control condition are indicated by asterisks. (B) Real-time quantitative PCR quantification of previously identified CCR4-NOT substrates, in samples with KD for CNOT1, CNOT10, or CNOT11. The same samples from control conditions used in Figure 4D (Exp. 1) and (A) (Exp. 2) were analyzed. Target mRNA levels were normalized to a house-keeping gene (GAPDH). Normalization to 18S rRNA, which is not a deadenylation substrate of CCR4-NOT, gave comparable results. Note that LEFTY2 mRNA levels were at or below the detection threshold for all samples except CNOT1-KD samples. For Exp. 1, data show the mean ± SD from 2 independent experiments, one of which contained 2 replicates for CNOT1 siRNAs. For Exp. 2, data show mean ± SD from 3 independent experiments. (C) Model of AlphaFold2 multimer predicted interaction between the C-terminal domain of CNOT11 with the α-helical domain of SCAPER. E620 and three highly conserved hydrophobic SCAPER residues predicted to interact with a hydrophobic patch on CNOT11 are highlighted. (D) Autoregulation assay with WT, SCAPER-KO, or SCAPER rescue cell lines with the indicated mutations targeting the predicted CNOT11 interaction surface. FL-SS: F628S, L632S; FIL-SKS: F628S, I629K, L632S; EE-KK: E618K, E625K; ED-KK: E633K, D640K (E) Autoregulation assay with WT, CNOT11-KO, or CNOT11 rescue cell lines with the indicated mutations targeting the predicted SCAPER interaction surface. LV-QQ: L405Q, V454Q; LV-SS: L405S, V454S; LLV-SSS: L405S, L451S, V454S; RR-EE1: R447E, R450E; RR-EE2: R461E, R485E. For (D) and (E), data show the mean ± SD from 2 independent experiments, one of which contained 2 replicates. Single, double, and triple asterisks indicate p < 0.05, p < 0.01, and p < 0.001, respectively; “ns” indicates not significant. See also Figures S7 and S8.
Figure 6
Figure 6
SCAPER is required for accurate mitosis (A) Example images of meta- and anaphase stages of HeLa cells going through mitosis in which chromosomes were visualized using SiR-DNA stain and maximum intensity projections are shown. Misaligned chromosomes and segregation errors are highlighted by green and magenta arrows, respectively. Schematics of accurate and erroneous cell division stages are shown below images. Chromosomes are shown in blue, MTs in dark green, centrosomes in light green. (B) Quantification of chromosome alignment errors in stable Flp-In HeLa T-REx cell lines with the indicated genotypes. (C) Quantification of chromosome segregation errors in stable Flp-In HeLa T-REx cell lines with the indicated genotypes. Data show mean ± SD from three independent experiments with 100 cells in total for (B) and (C). Unpaired, two-tailed Student's t tests were performed for each of the indicated cell lines with the WT cell line as reference. Single, double, and triple asterisks indicate p < 0.05, p < 0.01, and p < 0.001, respectively; “ns” indicates not significant. (D) Quantification of steady-state tubulin mRNA levels in the indicated HEK T-REx cell lines. Tubulin mRNA levels were normalized to a reference gene (RPLP1) and to the WT cell line, and data from all relevant experiments in the manuscript were compiled. Data show mean ± SD. Statistical analysis for SCAPER-KO and rescue cell lines was performed using a one-sample t test. Values significantly different from 1 (WT levels) are indicated by double and triple asterisks (p < 0.01, and p < 0.001, respectively; “ns” indicates not significant). n = 11 for WT and SCAPER-KO, n = 8 for KO + WT; data reanalyzed from Figures 3E, 3F, 5D, and S4D. See also Figure S9.
Figure 7
Figure 7
Model of regulated mRNA degradation in the tubulin autoregulation pathway Selective tubulin mRNA degradation is triggered when cells sense excess free tubulin levels, e.g., due to microtubule (MT) depolymerization, as depicted in the bottom schematic (N: nucleus). Under these conditions, TTC5 is liberated from an elusive inhibitory factor (not shown). This allows TTC5 to selectively bind tubulin-translating ribosomes by interacting with the conserved N-terminal peptide motif (Met-Arg-Glu-Ile or MREI, shown in dark blue) and a surface around the ribosomal exit tunnel. SCAPER recruitment is, in turn, facilitated by a composite interaction surface formed by TTC5 and the ribosome. The CCR4-NOT complex uses its CNOT11 subunit to bind an extended α-helical domain of SCAPER and its nuclease subunit(s) to deadenylate tubulin mRNA to initiate its subsequent degradation.

References

    1. Goodson H.V., Jonasson E.M. Microtubules and microtubule-associated proteins. Cold Spring Harb. Perspect. Biol. 2018;10:a022608. doi: 10.1101/cshperspect.a022608. - DOI - PMC - PubMed
    1. Gudimchuk N.B., McIntosh J.R. Regulation of microtubule dynamics, mechanics and function through the growing tip. Nat. Rev. Mol. Cell Biol. 2021;22:777–795. doi: 10.1038/s41580-021-00399-x. - DOI - PubMed
    1. Bodakuntla S., Jijumon A.S., Villablanca C., Gonzalez-Billault C., Janke C. Microtubule-associated proteins: structuring the cytoskeleton. Trends Cell Biol. 2019;29:804–819. doi: 10.1016/j.tcb.2019.07.004. - DOI - PubMed
    1. Janke C., Magiera M.M. The tubulin code and its role in controlling microtubule properties and functions. Nat. Rev. Mol. Cell Biol. 2020;21:307–326. doi: 10.1038/s41580-020-0214-3. - DOI - PubMed
    1. Nieuwenhuis J., Brummelkamp T.R. The tubulin detyrosination cycle: function and enzymes. Trends Cell Biol. 2019;29:80–92. doi: 10.1016/j.tcb.2018.08.003. - DOI - PubMed

LinkOut - more resources