. 2023 Jul;10(21):e2206540.
doi: 10.1002/advs.202206540. Epub 2023 Jun 9.

IGFBP1 Sustains Cell Survival during Spatially-Confined Migration and Promotes Tumor Metastasis

Affiliations

IGFBP1 Sustains Cell Survival during Spatially-Confined Migration and Promotes Tumor Metastasis

Guoqing Cai et al. Adv Sci (Weinh). 2023 Jul.

Abstract

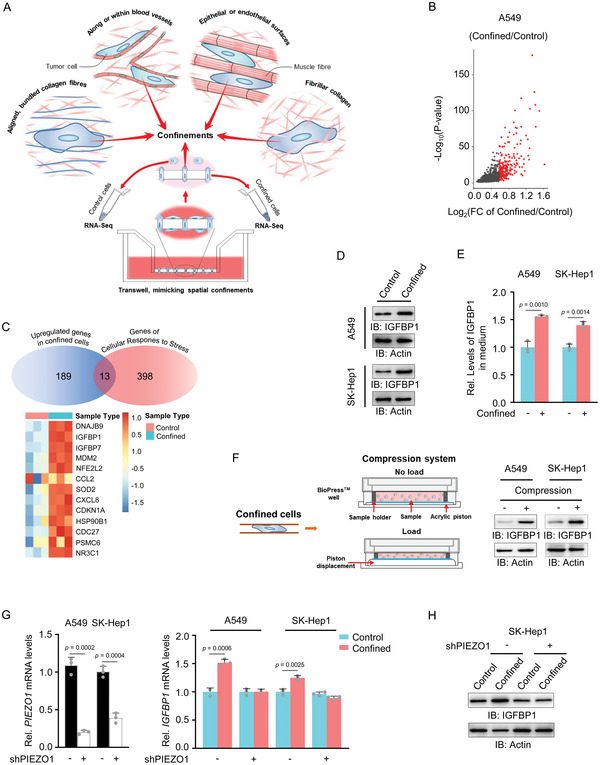
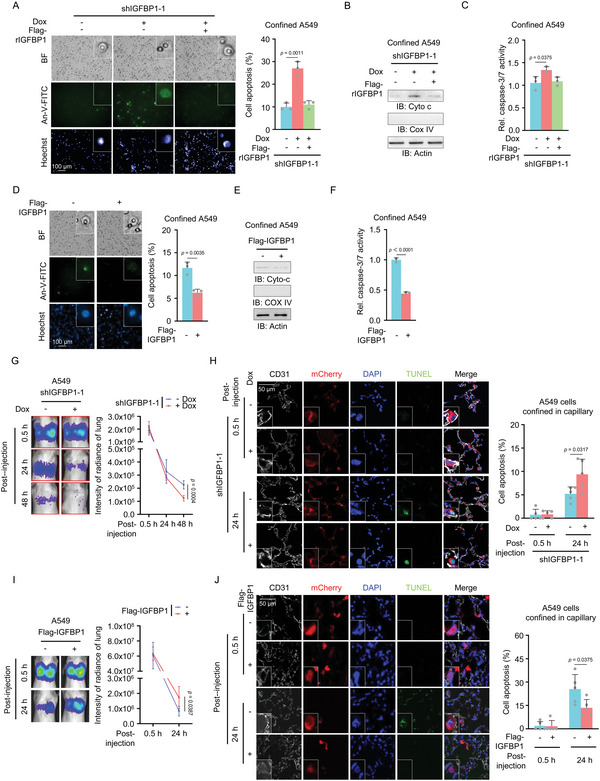
Cell migration is a pivotal step in metastatic process, which requires cancer cells to navigate a complex spatially-confined environment, including tracks within blood vessels and in the vasculature of target organs. Here it is shown that during spatially-confined migration, the expression of insulin-like growth factor-binding protein 1 (IGFBP1) is upregulated in tumor cells. Secreted IGFBP1 inhibits AKT1-mediated phosphorylation of mitochondrial superoxide dismutase (SOD2) serine (S) 27 and enhances SOD2 activity. Enhanced SOD2 attenuates mitochondrial reactive oxygen species (ROS) accumulation in confined cells, which supports tumor cell survival in blood vessels of lung tissues, thereby accelerating tumor metastasis in mice. The levels of blood IGFBP1 correlate with metastatic recurrence of lung cancer patients. This finding reveals a unique mechanism by which IGFBP1 sustains cell survival during confined migration by enhancing mitochondrial ROS detoxification, thereby promoting tumor metastasis.

Keywords: confined migration; insulin-like growth factor-binding protein 1; mitochondrial reactive oxygen species; superoxide dismutase; tumor metastasis.


Conflict of interest statement

The authors declare no conflict of interest.

Figures

Figure 1
Figure 1
IGFBP1 is upregulated in tumor cells during confined migration. A) Schematic model for sample preparation of confined cells for RNA sequencing analysis. Transwell migration assay was performed in A549 lung cancer cells with a chamber of 8 µm pore size. The migrating cells were split into two groups. In control group, the cells did not through the pores of transwell inserts. In confined group, the cells were constrained in the pores. RNA‐sequencing (RNA‐Seq) analysis was performed in these two groups of the cells. B) Volcano plot shows upregulated genes (Fold change > 1, p < 0.05, FPKM > 10) in the confined cells. Highly upregulated genes (Fold change > 1.5, p < 0.05, FPKM > 10) were highlighted in red. C) A Venn diagram was used to visually represent overlapped 13 genes between upregulated genes in confined cells and genes of cellular response to stress pathway in Reactome database (top panel). Overlapped 13 genes were displayed in a heatmap. D) IGFBP1 expression was examined in A549 or SK‐Hep1 cells with or without confinement by using immunoblotting analyses. Brefeldin A (5 µm), inhibitor of protein secretion. E) A549 or SK‐Hep1 cells were cultured in Transwell chambers with 0.4 or 8 µm pore size. Culture media of the cells were collected for the examination of secreted IGFBP1 by ELISA assay. In the chambers of 0.4 µm pore size, the cells could not migrate through the pores and served as the control cells for confined cells. Data represent the mean ± S.D. of three independent experiments. F) Left is a model of compression system. Right is IGFBP1 protein levels in A549 or SK‐Hep1 cells with or without mechanical compression (5 kPa) were examined by immunoblotting analyses. G) The mRNA levels of PIEZO1 and IGFBP1 in A549 and SK‐Hep1 cells with or without PIEZO1 depletion in the absence or presence of confinement were detected by quantitative PCR analysis. H) The protein levels of IGFBP1 in SK‐Hep1 cells with or without PIEZO1 depletion in the absence or presence of confinement were detected by immunoblotting analyses. Immunoblots are representative of three independent experiments.
Figure 2
Figure 2
IGFBP1 is required for tumor cell migration and metastasis in vivo. A,B) IGFBP1‐depleted A549 cells were rescued with or without Flag‐rIGFBP1. IGFBP1 expression was examined by immunoblotting analyses (A). Transwell migration assays were performed. Representative images (left panel) and statistical analysis (right panel) of the migrated cells was shown (B). Relative cell migration was normalized to A549 cells without IGFBP1 depletion. C,D) IGFBP1‐depleted SK‐Hep1 cells was rescued with Flag‐rIGFBP1. IGFBP1 expression was examined by immunoblotting analyses (C). Transwell migration assays were performed (D). Relative cell migration was normalized to SK‐Hep1 cells without IGFBP1 depletion. E) A549 or SK‐Hep1 cells were treated with IgG or anti‐IGFBP1 antibody. Transwell migration assays were performed. F) A549 or SK‐Hep1 cells were treated with or without recombinant IGFBP1. Transwell migration assays were performed. G,H) Luciferase‐expressing IGFBP1‐depleted A549 cells rescued with Flag‐rIGFBP1 were injected into randomized NOD/SCID mice by tail vein injection (five mice per group). After 30 days of inoculation, bioluminescence imaging was performed and representative images of lung metastasis were presented (G, left panel). The statistical analysis of luciferase intensities was shown (G, right panel). After bioluminescence imaging, mice were euthanized. Representative images of H&E staining of lung sections from these mice were shown (H, left panel). Tumor areas in H&E‐stained sections were calculated and normalized to those of the mice injected with A549 cells without IGFBP1 depletion (H, right panel). Data represent the mean ± S.D. of five mice. (B, D–F), Data represent the mean ± S.D. of three independent experiments.
Figure 3
Figure 3
IGFBP1 promotes tumor metastasis by sustaining cell survival during confined migration. A–C) IGFBP1‐depleted A549 cells were rescued with Flag‐rIGFBP1. Transwell migration assays were performed. After 6 h of culture, the confined cells were stained with Annexin‐V‐FITC and photographed in situ. Representative images of the apoptotic confined cells were presented (A, left panel). The percentages of apoptosis of confined cells were shown (A, right panel). Data represent the mean ± S.D. of three independent experiments. (B) The confined cells were harvested and subjected to cell fractionation assay. The cytoplasmic proteins were used for immunoblotting analyses. (C) Caspase‐3/7 activities of confined cells were examined with the caspase‐3/7 activity detection kit. Relative caspase‐3/7 activities were normalized to those of A549 cells without IGFBP1 depletion. Data represent the mean ± S.D. of three independent experiments. D–F) Transwell migration assays were performed in A549 cells with or without IGFBP1 overexpression. After 6 h of culture, the confined cells were stained with Annexin‐V‐FITC and photographed in situ. Representative images of the apoptotic confined cells were presented (D, left panel). The percentages of apoptosis of confined cells were shown (D, right panel). Data represent the mean ± S.D. of three independent experiments. (E) The confined cells were harvested and subjected to cell fractionation assay. The cytoplasmic proteins were used for immunoblotting analyses. (F) Caspase‐3/7 activities of confined cells were examined with the caspase‐3/7 activity detection kit. Relative caspase‐3/7 activities were normalized to those of A549 cells without IGFBP1 overexpression. Data represent the mean ± S.D. of three independent experiments. G) Luciferase‐expressing A549 cells with or without IGFBP1 depletion were injected into the tail vein of NOD/SCID mice (five mice per group). Bioluminescence imaging of these mice were performed at indicated time point and representative images of tumor cell signals in lung were shown (left panel). Data represent the mean ± S.D. of luciferase intensities from five mice (right panel). H) mCherry‐expressing A549 cells with or without IGFBP1 depletion were injected into NOD/SCID mice (five mice per group) via tail vein, and lungs of the mice were dissected at 0.5 or 24 h after injection. TUNEL staining and IF staining with anti‐CD31 antibody of the lung sections were performed. Representative images of apoptotic cells in blood vessels were shown (left panel). Percentages of apoptotic cells were calculated and shown (right panel). Data represent the mean ± S.D. of five mice. I) Luciferase‐expressing A549 cells with or without IGFBP1 overexpression were injected into the tail vein of NOD/SCID mice (five mice per group). Bioluminescence imaging of these mice were performed at indicated time point and representative images of tumor cell signals in lung were shown (left panel). Data represent the mean ± S.D. of luciferase intensities from five mice (right panel). J) mCherry‐expressing A549 cells with or without IGFBP1 overexpression were injected into NOD/SCID mice (five mice per group) via tail vein, and lungs of the mice were dissected at 0.5 or 24 h after injection. TUNEL staining and IF staining with anti‐CD31 antibody of the lung sections were performed. Representative images of apoptotic cells in blood vessels were shown (left panel). Percentages of apoptotic cells were calculated and shown (right panel). Data represent the mean ± S.D. of five mice.
Figure 4
Figure 4
IGFBP1 sustains the survival of confined cells by scavenging mitochondrial ROS. A,B) Transwell migration assays were performed in Mito‐roGFP‐expressing IGFBP1‐depleted A549 (A) or SK‐Hep1 (B) cells rescued with Flag‐rIGFBP1. After 6 h of culture, cells were photographed. Representative images of Mito‐roGFP in confined cells were presented (left panel). Mito‐roGFP fluorescence intensities of confined cells were normalized to those of the Mito‐roGFP‐expressing cells without IGFBP1 depletion and were shown (right panel). C) Transwell migration assays were performed in Mito‐roGFP‐expressing A549 cells. After 6 h of culture, cells were photographed in situ. Representative images of Mito‐roGFP in cells with or without confinement were presented (left panel). Mito‐roGFP fluorescence intensities of cells with or without confinement were normalized to those of the Mito‐roGFP‐expressing cells without confinement and were shown (right panel). D,E) Mito‐roGFP‐expressing A549 (D) or SK‐Hep1 (E) cells with or without IGFBP1 depletion were seeded in the 96‐well plates. After 24 h of culture, the cells were photographed and representative images of Mito‐roGFP were presented (top panel). Relative Mito‐roGFP fluorescence intensities were normalized to those of Mito‐roGFP‐expressing cells without IGFBP1 depletion (bottom panel). F) IGFBP1‐depleted A549 cells were rescued with Flag‐rIGFBP1. The cells were treated with or without NAC (5 mm). Transwell migration assays were performed. After 6 h of culture, the cells were stained with Annexin‐V‐FITC and photographed in situ. Representative images of the apoptotic confined cells were presented (left panel). The percentages of apoptosis of confined cells were shown on the right panel. (A–F), Data represent the mean ± S.D. of three independent experiments.
Figure 5
Figure 5
IGFBP1 scavenges mitochondrial ROS by activating SOD2. A) Mito‐roGFP‐expressing IGFBP‐depleted A549 cells were overexpressed with empty vector (EV), SOD2, GPX4, or TRXR2. Transwell migration assay was performed. After 6 h of culture, cells were photographed. Representative images of Mito‐roGFP in confined cells were presented (left panel). Mito‐roGFP fluorescence intensities of confined cells were normalized to those of the Mito‐roGFP‐expressing cells without IGFBP1 depletion and shown on the right panel. B) Mito‐roGFP‐expressing IGFBP‐depleted A549 cells were overexpressed with EV or SOD2. Transwell migration assays were performed. After 6 h of culture, cells were stained with Annexin‐V‐FITC and photographed in situ. Representative images of the apoptotic confined cells are presented (left panel). The percentages of apoptosis of confined cells were shown on the right panel. C) IGFBP1‐depleted A549 and SK‐Hep1 cells were overexpressed with EV or SOD2. Transwell migration assays were performed. D) IGFBP1‐depleted A549 and SK‐Hep1 cells were overexpressed with EV or SOD2. Transwell migration assays were performed. After 6 h of culture, SOD2 activities of confined cells were measured by WST‐8 kit (Beyotime Biotechnology). Relative SOD2 activities were normalized to the cells without IGFBP1 depletion. (A–D), Data represent the mean ± S.D. of three independent experiments.
Figure 6
Figure 6
IGFBP1 enhances SOD2 activity by inhibiting AKT1‐dependent SOD2 pS27 and promotes tumor metastasis. A) Transwell migration assays of A549 cells with or without IGFBP1 depletion were performed. After 6 h of culture, the confined cells were collected and subjected to immunoblotting analyses with indicated antibodies. B) A549 cells with or without IGFBP1 depletion were treated with or without the inhibitor of MEK (PD0325901, 10 µm) or AKT1/2/3 (MK2206, 5 µm), followed by Transwell migration assays. After 6 h of culture, SOD2 activities in confined cells were measured by WST‐8 kit. Relative SOD2 activities were normalized to the cells without IGFBP1 depletion. C) In vitro kinase assay was performed by mixing bacterial‐ purified recombinant GST‐AKT1 and recombinant WT or S27A mutant SOD2. D) Transwell migration assays of SOD2‐depleted A549 cells rescued with Flag‐rSOD2 WT or S27A were performed. After 6 h of culture, SOD2 activities in confined cells were measured by WST‐8 kit. Relative SOD2 activities were normalized to rSOD2 WT. E) Transwell migration assays of A549 cells with or without IGFBP1 were performed. After 6 h of culture, SOD2 S27 phosphorylations of confined cells were detected. F) Mito‐roGFP‐expressing SOD2‐depleted A549 cells were rescued with WT or S27D mutant SOD2. Transwell migration assays were performed. Representative images of Mito‐roGFP in confined cells were presented (left panel). Mito‐roGFP fluorescence intensities of confined cells were normalized to those of the cells expressing rSOD2 WT (right panel). G) SOD2‐depleted A549 cells were rescued with WT or S27D mutant SOD2. Transwell migration assays were performed. After 6 h of culture, the cells were stained with Annexin‐V‐FITC and photographed in situ. Representative images of the apoptotic confined cells were presented on the left panel. The percentages of apoptosis of confined cells were shown on the right panel. H,I) Luciferase‐expressing SOD2‐depleted A549 cells rescued with WT or S27D mutant SOD2 were injected into randomized NOD/SCID mice by tail vein injection (five mice per group). After 30 days inoculation, bioluminescence imaging was performed and representative images of lung metastasis were presented (right panel). The statistical analysis of luciferase intensities was shown respectively on the left panel (H). Data represent the mean ± S.D. of five mice. After bioluminescence imaging, mice were euthanized. Representative images of H&E staining of lung sections from these mice were shown (I, right). Tumor areas in H&E‐stained sections were calculated and normalized to those of the mice injected with A549 cells expressing WT SOD2 (I, left). Data represent the mean ± S.D. of five mice. (B, D, F, G), Data represent the mean ± S.D. of three independent experiments.
Figure 7
Figure 7
IGFPB1 promotes the survival of confined cells and tumor metastasis by inhibiting SOD2 S27 phosphorylation. A) IGFBP1 was depleted in SOD2‐depleted A549 cells rescued with rSOD2 WT or S27A. Transwell migration assays were performed. After 6 h of culture, the confined cells were stained with Annexin‐V‐FITC and photographed in situ. Representative images of the apoptotic confined cells were presented (left panel). The percentages of apoptosis of confined cells were shown (right panel). Data represent the mean ± S.D. of three independent experiments. B,C) IGFBP1 was depleted in SOD2‐depleted A549 cells rescued with rSOD2 WT or S27A. Transwell migration assays were performed (B). Representative images (top panel) and statistical analysis (bottom panel) of the migrated cells was shown. Data represent the mean ± S.D. of three independent experiments. These cells were implanted into randomized NOD/SCID mice by tail vein injection (five mice per group). After 30 days inoculation, the mice were euthanized. Tumor areas in H&E‐stained sections were calculated and normalized (C). Data represent the mean ± S.D. of five mice. D) IGFBP1 was overexpressed in SOD2‐depleted A549 cells rescued with rSOD2 WT or S27D. Transwell migration assays were performed. After 6 h of culture, the confined cells were stained with Annexin‐V‐FITC and photographed in situ. Representative images of the apoptotic confined cells were presented (left panel). The percentages of apoptosis of confined cells were shown (right panel). Data represent the mean ± S.D. of three independent experiments. E,F) IGFBP1 was overexpressed in SOD2‐depleted A549 cells rescued with rSOD2 WT or S27D. Transwell migration assays were performed (E). Representative images (top panel) and statistical analysis (bottom panel) of the migrated cells were shown. Data represent the mean ± S.D. of three independent experiments. These cells were injected into randomized NOD/SCID mice by tail vein injection (five mice per group). After 30 days inoculation, the mice were euthanized. Tumor areas in H&E‐stained sections were calculated and normalized (F). Data represent the mean ± S.D. of five mice.
Figure 8
Figure 8
Schematic model for IGFBP1‐promoted tumor metastasis by sustaining cell survival during confined migration. IGFBP1 promotes tumor metastasis by sustaining cell survival during confined migration. Mechanistically, IGFBP1 enhances SOD2 activity by preventing AKT1‐mediated SOD2 S27 phosphorylation to scavenge accumulated mitochondrial ROS, thereby sustaining cell survival in confined space.

Similar articles

Cited by

References

    1. Gupta G. P., Massague J., Cell 2006, 127, 679. - PubMed
    1. Chaffer C. L., Weinberg R. A., Science 2011, 331, 1559. - PubMed
    1. Muller A., Muller S., Nasufovic V., Arndt H. D., Pompe T., Integr. Biol. 2019, 11, 175. - PubMed
    1. Wolf K., Alexander S., Schacht V., Coussens L. M., von Andrian U. H., van Rheenen J., Deryugina E., Friedl P., Semin. Cell Dev. Biol. 2009, 20, 931. - PMC - PubMed
    1. Alexander S., Koehl G. E., Hirschberg M., Geissler E. K., Friedl P., Histochem. Cell Biol. 2008, 130, 1147. - PubMed

Publication types

Substances