. 2023 Jul;10(20):e2205804.
doi: 10.1002/advs.202205804. Epub 2023 Jun 9.

Transplanting Human Neural Stem Cells with ≈50% Reduction of SOX9 Gene Dosage Promotes Tissue Repair and Functional Recovery from Severe Spinal Cord Injury

Affiliations

Transplanting Human Neural Stem Cells with ≈50% Reduction of SOX9 Gene Dosage Promotes Tissue Repair and Functional Recovery from Severe Spinal Cord Injury

Jessica Aijia Liu et al. Adv Sci (Weinh). 2023 Jul.

Abstract

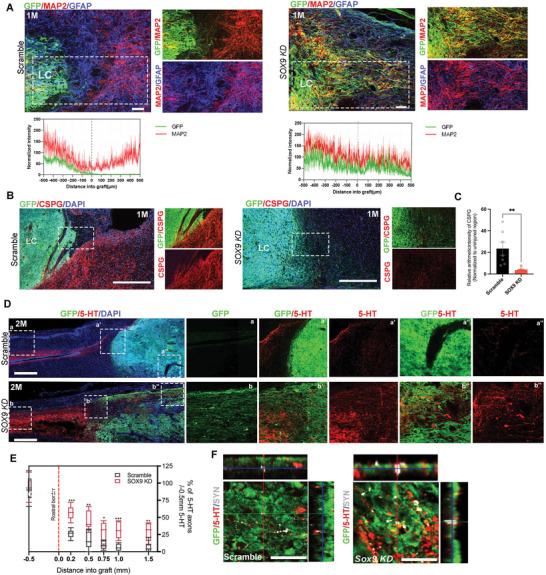
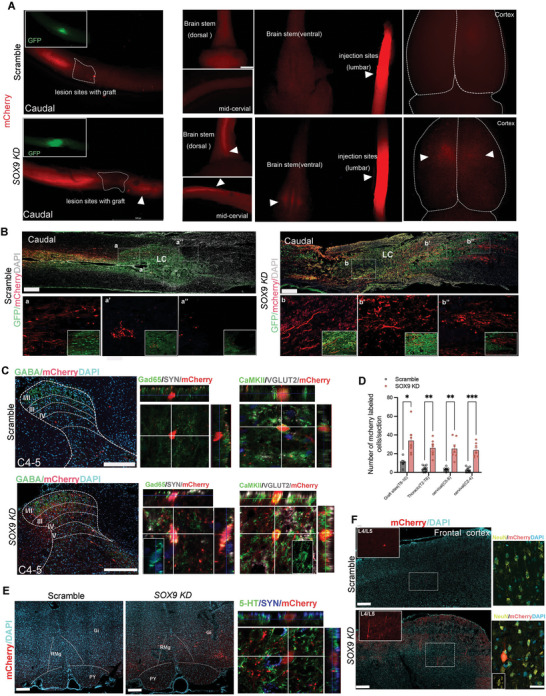
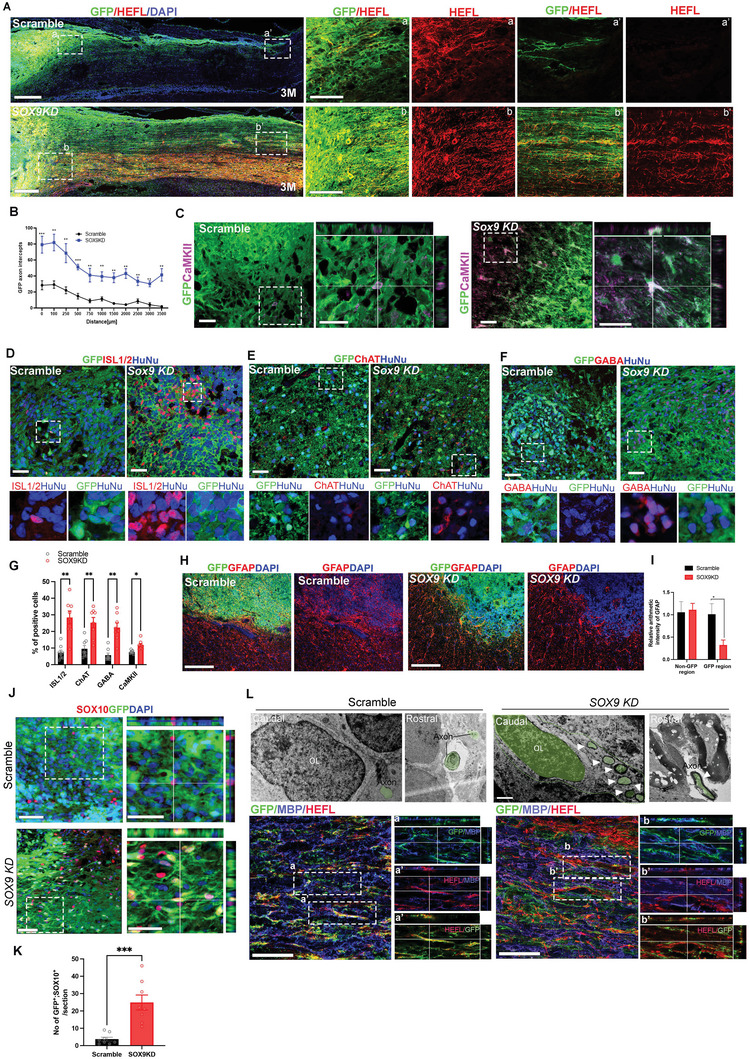
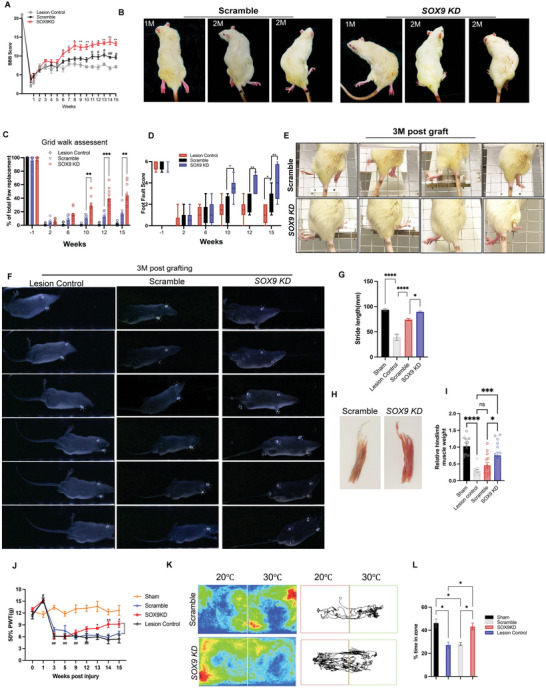
Neural stem cells (NSCs) derived from human pluripotent stem cells (hPSCs) are considered a major cell source for reconstructing damaged neural circuitry and enabling axonal regeneration. However, the microenvironment at the site of spinal cord injury (SCI) and inadequate intrinsic factors limit the therapeutic potential of transplanted NSCs. Here, it is shown that half dose of SOX9 in hPSCs-derived NSCs (hNSCs) results in robust neuronal differentiation bias toward motor neuron lineage. The enhanced neurogenic potency is partly attributed to the reduction of glycolysis. These neurogenic and metabolic properties retain after transplantation of hNSCs with reduced SOX9 expression in a contusive SCI rat model without the need for growth factor-enriched matrices. Importantly, the grafts exhibit excellent integration properties, predominantly differentiate into motor neurons, reduce glial scar matrix accumulation to facilitate long-distance axon growth and neuronal connectivity with the host as well as dramatically improve locomotor and somatosensory function in recipient animals. These results demonstrate that hNSCs with half SOX9 gene dosage can overcome extrinsic and intrinsic barriers, representing a powerful therapeutic potential for transplantation treatments for SCI.

Keywords: SOX9; human neural stem cells; motor neurons; pluripotent stem cells; spinal cord injury.


Conflict of interest statement

The authors declare no conflict of interest.

Figures

Figure 1
Figure 1
Gradual loss of SOX9 expression in hNSCs is associated with the acquisition of neuronal fate. A) Representative images showing SOX9 and MAP2 expressions in GFP+ grafts in the non‐injury and injured spinal cords at 2 months after grafting. The white boxes show a magnified view with the indicated markers (scale bar for the magnified view, 200 µm; scale bar for the lower power view, 50 µm). B) Quantification of SOX9 + or MAP+ cells in GFP+ grafts from non‐injury and injured spinal cords. n = 5, 3–4 sections/rat, Student's t‐test. C) Overview of the neural induction and neuronal differentiation protocol from human pluripotent stem cells (hPSCs). D) Representative immunofluorescence images for SOX2, SOX9, and HuC/D in hNSCs after 7 days differentiation (DIV) and for MAP2, SOX9, and ISLET1/2 after 21 days differentiation. White arrowheads indicate a moderate reduction of SOX9 during neuronal differentiation. The empty arrow indicates differentiating neuronal cells without SOX2 expression but exhibits a moderate reduction of SOX9 (scale bar, 50 µm). Three independent experiments. E) Representative immunoblot images showing time course analysis of SOX9 expressions in hNSCs and neuronal differentiation. Three independent experiments. F) Time course analysis of neuronal markers NeuN and ISL1/2, SOX2, and SOX9 expressions by qPCR. Three independent experiments. All data are expressed as Mean ± SEM.
Figure 2
Figure 2
Dose‐dependent SOX9 regulation of survival, renewal, and onset of differentiation in hNSCs. A) Experimental paradigm for B–H). (B) Dose‐dependent silencing of SOX9 mRNA in hNSCs analyzed by immunoblotting and qPCR. C) Representative immunofluorescence images for Caspase 3, neural progenitor marker PAX6, and nuclei marker DAPI upon dose‐dependent inhibition of SOX9 in hNSCs (Scale bar, 100 µm). White box shows a magnified view with indicated markers (Scale bar, 50 µm). D) Quantification of Caspase 3+ cells from (C). Student t‐test. E) Representative bright‐field images of neurospheres treated with DMOS as control and different dosages of Dox. F) Quantification of neurosphere number and size upon dose‐dependent inhibition of SOX9. One‐way ANOVA followed by Tukey's post‐hoc test. All data are expressed as mean ± SEM (Scale bar, 100 µm). Three independent experiments were performed. G) Representative immunofluorescence images for NEUROG2 (NGN2), SOX2, PAX6, NKX6.1, and OLIG2 upon dose‐dependent inhibition of SOX9 in hNSCs (Scale bar, 100 µm). White box shows a magnified view with indicated markers (Scale bar, 50 µm) H) Percentage of PAX6+, OLIG2+, NKX6.1+, and NEUROG2+ in SOX2+ cells upon dose‐dependent inhibition of SOX9. One‐way ANOVA followed by Tukey's post‐hoc test. Three independent experiments were performed. I) Representative immunofluorescence images for HuC/D and DAPI in neurospheres upon dose‐dependent inhibition of SOX9 (Scale bar, 100 µm). White box shows a magnified view with indicated markers. Three independent experiments were performed. J) Quantification of HuC/D+ cells from (I), Student t‐test. For all experiments, data are expressed as mean ± SEM, *p < 0.01, **p < 0.05, ***p <0. 005.
Figure 3
Figure 3
Moderate reduction of SOX9 in hNSCs promotes robust neuronal differentiation and maturation. A) Heatmap shows the differential gene expression changes in the scramble and SOX9 KD hNSCs. B) The Pearson correlation coefficient between scramble and SOX9 KD hNSCs. (C) Volcano plot showing the differential levels of gene expression between scramble and SOX9 KD hNSCs. Red denotes significantly upregulated genes and blue denotes significantly downregulated genes. D) GO term analysis of upregulated genes from the RNA‐seq analysis of SOX9 KD hNSCs compared to scramble hNSCs. List of the top 15 GO terms ranked by p‐value (Fisher's exact test with Benjamini‐Hochberg correction). E) Heatmaps depict transcriptional changes in neuronal differentiation genes, dorsal‐ventral patterning genes, spinal genes, and key metabolic genes in glycolysis and tricarboxylic acid cycle (TCA) pathways in the scramble and SOX9 KD hNSCs. Red denotes upregulated genes and blue denotes downregulated genes. F) qPCR analysis of markers associated with neural tube patterning, neuronal differentiation, and spinal markers. One‐way ANOVA followed by Tukey's post‐hoc test. G) qPCR analysis of key metabolic genes in glycolysis and TCA pathways in the scramble and SOX9 KD hNSCs. H) Representative bright field (BF) images of scramble and SOX9 KD hNSCs and immunofluorescence for SOX2, TUJ1, and DAPI at 7 days differentiation in the absence of neurotrophic factors. Black line indicates the length of extended axons from the border of the neurosphere (Scale bar, 100 µm). White box shows the magnified view with indicated markers. I) Quantification of the relative length of extended axon in the scramble and SOX9 KD neurospheres. (n = 9 per group from three independent experiments). J) Representative immunofluorescence images for MAP2, ISLET1/2, ChAT, and synaptophysin (SYN) of scramble and SOX9 KD hNSCs at 14 days differentiation. White box shows a magnified view with indicated markers (Scale bar, 100 µm). K) Percentage of ISLET1/2‐ and ChAT‐positive cells in the scramble and SOX9 KD hNSCs after 14 days differentiation. Three independent experiments L) Quantification of synaptophysin counts between SOX9 KD and scramble at 14 days differentiation. Three independent experiments. Student's t‐test. For all experiments, data are expressed as mean ± SEM. *p < 0.01, **p < 0.05, ***p <0.005 versus scramble. Three independent experiments.
Figure 4
Figure 4
Reduced level of SOX9 inhibits glycolysis in hNSCs. A) Representative images of immunolabeled TUJ1 (red) and fluorescent glucose (2‐NBDG) uptake in hNSCs with the scramble and dose‐dependent inhibition of SOX9 expression. a‐a’, b‐b’, and c‐c’ show higher magnification with indicated markers. Empty arrows indicate 2‐NBDG‐negative cells with Tuj1 expression and white arrowheads indicate strong 2‐NBDG‐positive cells without Tuj1 expression. Green arrowheads indicate weak 2‐NBDG‐expressing cells. B) Quantification of different intensities of 2‐NBDG positive cells in (A). C) Quantification of Tuj1 positive cells in (A). D) Schematic diagram showing experimental strategy for SOX9 overexpression (OE) and generation of neuronal/glial from different treatment groups. E) Representative immunofluorescence images for Caspase 3 upon dose‐dependent inhibition of glycolysis by 2‐DG inhibitor (Scale bar = 100 µm). F) Quantification of Caspase 3+ cells in (E). One‐way ANOVA followed by Tukey's post‐hoc test. G) Representative immunofluorescence images for MAP2, GFAP, and PDGFR‐α after 3 weeks differentiation of hNSCs with the indicated treatments (Scale bar = 50 µm). H) Quantification of GFAP+, MAP+, and PDGFR‐α+ cells in different treatments. One‐way ANOVA followed by Tukey's post‐hoc test. All data are expressed as mean ± SEM. For the above analysis, three independent experiments were performed. *p < 0.05, **p < 0.01, ****p < 0.0001.
Figure 5
Figure 5
SOX9 KD grafts exhibit efficient distribution into lesion cavities and integration in the absence of growth factors in the SCI model. A) Representative immunofluorescence images for GFP, MAP2 (red), and GFAP (Blue) in sagittal sections with scramble and SOX9 KD grafts at 1 month (1 m) post‐graft. The cystic lesion cavity (LC) is surrounded by dense GFAP immunoreactivity (blue) in scramble control, whereas GFP+ SOX9 KD grafts extend across GFAP barriers. White box shows a magnified view with indicated markers (Scale bar, 100 µm). Lower panel shows the line scan of fluorescence intensity with indicated markers across the lesion cavity of recipients with scramble and SOX9 KD grafts. (n = 7 rats per group, 4–5 sections per rat) B) Representative immunofluorescence images for GFP, CSPG (red), and DAPI (Blue) in spinal cord sagittal sections grafted with the scramble and SOX9 KD hNSCs at 1‐month post‐graft. The cystic lesion cavity (LC) formed with surrounding dense CSPG immunoreactivity (red). White box shows a zoomed‐in view with indicated markers. SOX9 KD grafts attenuated CSPG graft/host interface (Scale bar, 500 µm). C) Relative fluorescence intensity analysis of CSPG surrounding the lesion cavity that normalized to the uninjured region (n = 7 rats per group, 4–5 sections per rat). **p < 0.05. D) Representative images of host serotonergic axons immunolabeled with 5‐HT (red) extending into the scramble and SOX9 KD grafts at 2 months post‐transplantation. a‐a’’ and b‐b’’ show high magnification of 5‐HT+ fibers innervating into the graft at different regions from rostral to caudal (Scale bar, 100 µm). E) Quantification of the portion of host 5‐HT+ serotonergic axons in the scramble and SOX9 KD grafts, normalized to the total number of 5‐HT+ axons located 0.5 mm rostral to the lesion site (n = 6 rats per group, 3–4 sections per rat). One‐way ANOVA. **p < 0.05, ***p < 0.005. F) Triple immunolabeling of host 5‐HT+ fibers, proximal hsyn, and GFP‐terminals indicating the establishment of synaptic contacts between the host raphespinal fibers and SOX9 KD grafted cells (n = 6 rats per group, 3–4 sections per rat, Scale bar, 50 µm).
Figure 6
Figure 6
Retrograde tracing of host connectivity with neurotropic viruses. A) Macroscopical view of retrograde labeling of host projection following injections of AAV2‐retro‐Syn‐mCherry in the lumbar spinal cords at 3 months post‐graft. The left panel shows mCherry labeling of host connectivity in the T8 injured spinal cord grafted with the scramble and SOX9 KD hNSCs. Insets show grafts expressing GFP. White arrowheads indicate traced host mCherry‐expressing cells rostral to the SOX9 KD graft in the lesion site. The right panel shows strong expression of mCherry in the lumbar (L2) injection sites and retrogradely traced host mCherry‐expressing cells in the cervical spinal cord, brainstem (ventral and dorsal), and cortex rostral to the T8 SCI site. Scale bar, 500 µm. B) Sagittal section showing retrograde labeling of host cells expressing mCherry from caudal to rostral in injured spinal cords with the scramble and SOX9 KD grafts at 3 months post‐transplantation. High magnification of mCherry+ projections along the grafts from rostral to caudal is shown in panels a‐a’’ and b‐b’’. Numerous mCherry+ host neurons are scattered throughout the SOX9 KD graft. Scale bar, 200 µm. C) Retrograde labeling host cells at the cervical level (C4‐5) in lamina I‐IV, with inner lamina I/II indicated by GABA (green) staining. Triple labeling for mCherry/SYN/Gad65 and mCherry/VGLUT2/CaMKII at the cervical spinal cord level. Scale bars, 100 µm. D) Quantification of the number of mCherry+ cells on cross‐sections of injured spinal cords with the scramble and SOX9 KD grafts at thoracic and cervical levels. E) Retrograde mCherry+ projections were founded in the caudal raphe magnus nucleus (RMg), gigantocellular reticular nucleus (Gi), and pyramidal tract (PY) within the brainstem of recipients with SOX9 KD grafts but not with scramble grafts. The panel shows projected mCherry‐expressing cells forming synaptic connections with 5‐HT+ serotonergic neurons in RMg. Scale bar, 500 µm. F) Retrograde mCherry+ projections were found in the somatosensory cortex of recipients with SOX9 KD grafts and co‐localized with neurons (NeuN, yellow), which display a classical pyramidal cell morphology. Scale bars, 500 µm. Student t‐test. All data are presented as mean ± SEM. n =  7‐8 rats per group, at least five sections per rat were analyzed for immunohistochemistry. *p < 0.05, **p < 0.01,***p < 0.001.
Figure 7
Figure 7
SOX9 KD hNSC grafts display enhanced differentiation capacity toward beneficial neuronal subtypes in the absence of growth factors in the SCI model. A) GFP and HNEFL immunolabeling in spinal cord sagittal sections revealed GFP‐expressing SOX9 KD grafts at injured sites generated robust axons extending into the host spinal cord caudally after 3 months post‐graft. a‐a’’ and b‐b’’ indicate higher magnification of HEFL‐positive fibers in the graft at different regions of rostral to caudal (n = 6 rats per group, 3–4 sections per rat, Scale bar, 100 µm). B) Quantification of axon intercepts at specific distances from graft‐host border in the injured cord grafted with scramble and SOX9 KD hNSCs. **p < 0.01, ***p < 0.001, one‐way ANOVA with Bonferroni. C) Grafts from scramble and Sox9 KD immunolabeled with GFP and excitatory neurons (CaMKII), and D) HuNu antibody to confirm the human origin of the cells together with differentiating motor neuronal marker (ISL1/2), E) mature motor neuronal marker choline acetyltransferase (ChAT), and F) inhibitory neuronal marker (GABA) at 2 months post‐graft. White box shows a zoomed‐in view of the co‐localization of the indicated markers (Scale bar = 50 µm). G) Quantification of the percentage of neuronal subtypes (ISL1/2, ChAT, GABA, and CaMKII) among HuNu‐positive or GFP‐positive scramble and SOX9 KD grafts (n = 7 rats per group, 3–4 sections/rat). *p < 0.05, **p < 0.01, **p < 0.005. H) GFP‐positive grafts from the scramble and SOX9 KD were immunolabeled with astrocytes marker (GFAP, red) 3 months post‐graft. Dashed lines indicate graft/host border (Scale bar = 200 µm). I) Quantification of GFAP relative intensity in graft/non‐graft regions of the injured cord grafted with the scramble and SOX9 KD grafts (n = 7–8 rats per group, 3–4 sections/rat). J) GFP‐positive grafts from the scramble and SOX9 KD immunolabeled with oligodendrocyte marker (SOX10, red) at 3 months post‐graft. White box shows a zoomed‐in view of the co‐localization of indicated markers (Scale bar = 50 µm). K) Quantification of the number of SOX10‐ and GFP‐positive cells in the injured cord grafted with scramble and SOX9 KD hNSCs (n = 7–8 rats per group, 3–4 sections/rat). ***p < 0.005. L) Transmission electron microscopy showed that diaminobenzidine (DAB)‐labeled GFP‐expressing scramble and SOX9 KD grafts in the injury sites and caudal region. GFP+ cells deposited with DAB in SOX9 KD grafts can form oligodendrocytes (OL) and human axons that are wrapped by myelin‐like structures (white arrowheads). Scale bars, 1 mm. Lower panels show GFP‐positive grafts from scramble and SOX9 KD immunolabeled with HNEFL(red) and myelination marker (MBP, blue) at 3 months post‐graft. Insets of a‐a’ and b‐b'show the co‐localizations of GFP‐positive grafts with indicated markers in the injury site (Scale bar, 100 µm). n = 6 rats per group for EM. n = 8 rats per group for fluorescence immunostaining. All data are presented as mean ± SEM.
Figure 8
Figure 8
Significant functional improvement after transplantation of SOX9 KD hNSC grafts into contusive SCI. A) BBB scores of lesion control, and pre‐and post‐grafting with scramble and SOX9 KD hNSCs. Two‐way repeated‐measures ANOVA followed by post‐hoc Fisher's exact test. *p < 0.05, **p <0.01 SOX9 KD versus scramble; #p <0.05, ##p < 0.02 scramble versus lesion control. B) Representative images showing hind limb movement in grid walking of SCI rats grafted with scramble and SOX9 KD hNSCs at 1 and 2 months (M) post‐graft. C) Grid walk quantitative analysis measured as a percentage of hind limb placement. One‐way ANOVA with Tukey's post‐hoc test; *p < 0.05, **p < 0.01. D) Foot fault score analysis of hind limb measured by rating scale for foot placement in the skilled ladder rung walking test (correct placement = 6 points; partial placement = 5 points; placement correction = 4 points; replacement = 3 points; slight slip = 2 points; deep slip = 1 point; and total miss = 0 points). One‐way ANOVA with Tukey's post‐hoc test; *p < 0.05, **p < 0.01. E) Representative images showing foot placement during ladder rung walking in SCI rats grafted with scramble and SOX9 KD hNSCs after 3 months post‐graft. F) Representative video images showing footprints of SCI (lesion control) and SCI rats grafted with scramble and SOX9 KD hNSCs after 3 months post‐graft. G) Quantification of stride length in sham, SCI(lesion control), and SCI rats with scramble and SOX9 KD grafts. Student's t‐test. *p < 0.05, **p < 0.01. H) Representative images of hind limb muscle from SCI rats grafted with scramble and SOX9 KD hNSCs after 3 months post‐graft. I) Relative quantification of muscle weight from sham, SCI (lesion control), and SCI rats grafted with scramble and SOX9 KD NSCs. One‐way ANOVA followed by Tukey's post‐hoc test. *p < 0.05, ***p < 0.001, ****p < 0.0001. J) Time course of the mechanical allodynia, as measured by the von Frey force threshold for withdrawal in sham and SCI rats with scramble and SOX9 KD grafts. *p < 0.05, **p < 0.01 SOX9 KD versus scramble; ##p <0.01 SOX9 KD versus sham. Two‐way repeated‐measures ANOVA. K) Representative track imaging of the two‐plate preference test at 30 °C versus 20 °C after 3 months post‐graft (14 weeks post‐injury). L) Occupancy quantification of 30 °C versus 20 °C after 3 months post‐graft. *p < 0.05; Two‐tailed unpaired Student's t‐test. All data are expressed as mean ± SEM. n = 9 (scramble); n = 8 (lesion Control); n = 10 (SOX9 KD); n = 9 (Sham).

Similar articles

Cited by

References

    1. a) Silver J., Miller J. H., Nat. Rev. Neurosci. 2004, 5, 146; - PubMed
    2. b) Hara M., Kobayakawa K., Ohkawa Y., Kumamaru H., Yokota K., Saito T., Kijima K., Yoshizaki S., Harimaya K., Nakashima Y., Okada S., Nat. Med. 2017, 23, 818; - PubMed
    3. c) Bradbury E. J., Burnside E. R., Nat. Commun. 2019, 10, 3879. - PMC - PubMed
    1. a) Yokota K., Kobayakawa K., Kubota K., Miyawaki A., Okano H., Ohkawa Y., Iwamoto Y., Okada S., Stem Cell Rep. 2015, 5, 264; - PMC - PubMed
    2. b) Dell'Anno M. T., Wang X., Onorati M., Li M., Talpo F., Sekine Y., Ma S., Liu F., Cafferty W. B. J., Sestan N., Strittmatter S. M., Nat. Commun. 2018, 9, 3419; - PMC - PubMed
    3. c) Kumamaru H., Kadoya K., Adler A. F., Takashima Y., Graham L., Coppola G., Tuszynski M. H., Nat. Methods 2018, 15, 723; - PubMed
    4. d) Rosenzweig E. S., Brock J. H., Lu P., Kumamaru H., Salegio E. A., Kadoya K., Weber J. L., Liang J. J., Moseanko R., Hawbecker S., Huie J. R., Havton L. A., Nout‐Lomas Y. S., Ferguson A. R., Beattie M. S., Bresnahan J. C., Tuszynski M. H., Nat. Med. 2018, 24, 484. - PMC - PubMed
    1. a) Martino G., Pluchino S., Nat. Rev. Neurosci. 2006, 7, 395; - PubMed
    2. b) Yoshizaki S., Tamaru T., Hara M., Kijima K., Tanaka M., Konno D. J., Matsumoto Y., Nakashima Y., Okada S., J Neuroinflammation 2021, 18, 12; - PMC - PubMed
    3. c) Khazaei M., Ahuja C. S., Nakashima H., Nagoshi N., Li L., Wang J., Chio J., Badner A., Seligman D., Ichise A., Shibata S., Fehlings M. G., Sci. Transl. Med. 2020, 12, 525. - PubMed
    1. Lu P., Ceto S., Wang Y., Graham L., Wu D., Kumamaru H., Staufenberg E., Tuszynski M. H., J. Clin. Invest. 2017, 127, 3287. - PMC - PubMed
    1. a) Stolt C. C., Lommes P., Sock E., Chaboissier M. C., Schedl A., Wegner M., Genes Dev. 2003, 17, 1677; - PMC - PubMed
    2. b) Scott C. E., Wynn S. L., Sesay A., Cruz C., Cheung M., Gomez Gaviro M. V., Booth S., Gao B., Cheah K. S., Lovell‐Badge R., Briscoe J., Nat. Neurosci. 2010, 13, 1181. - PubMed

Publication types

Substances