. 2023 Jun 9;14(1):3423.
doi: 10.1038/s41467-023-38723-y.

Neutralizing IFNγ improves safety without compromising efficacy of CAR-T cell therapy in B-cell malignancies

Affiliations

Neutralizing IFNγ improves safety without compromising efficacy of CAR-T cell therapy in B-cell malignancies

Simona Manni et al. Nat Commun. .

Abstract

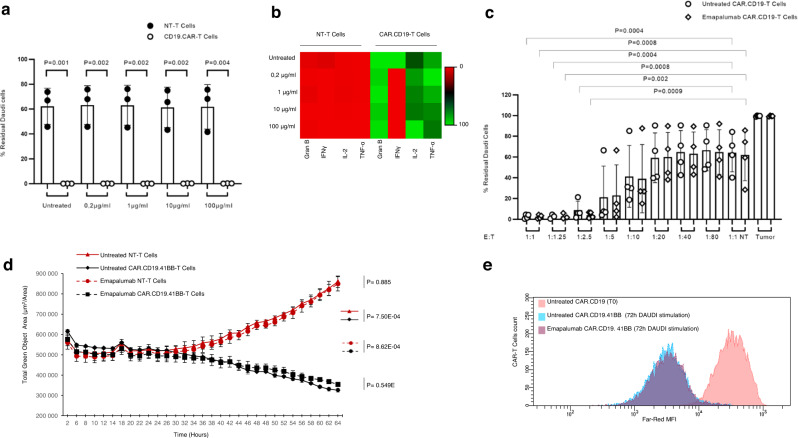
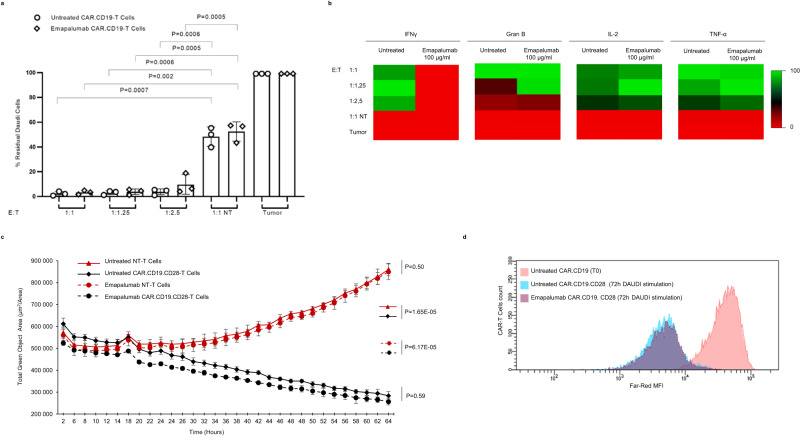
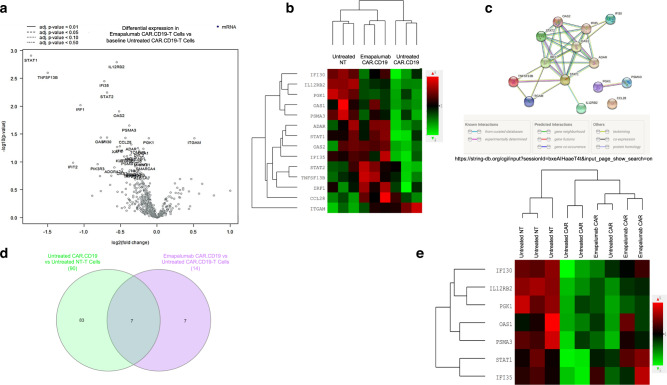
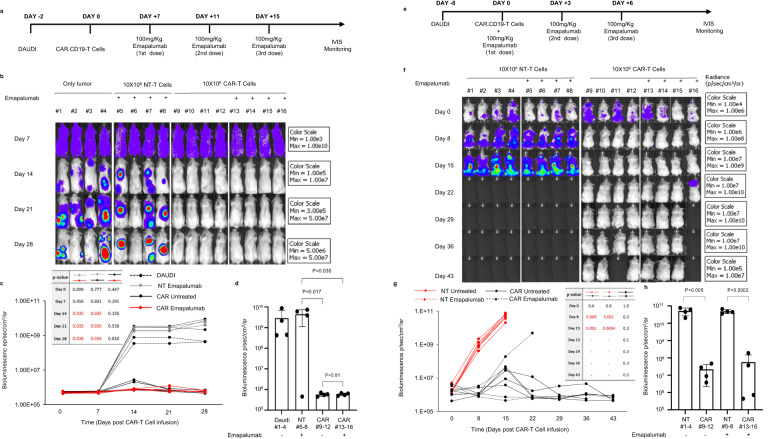
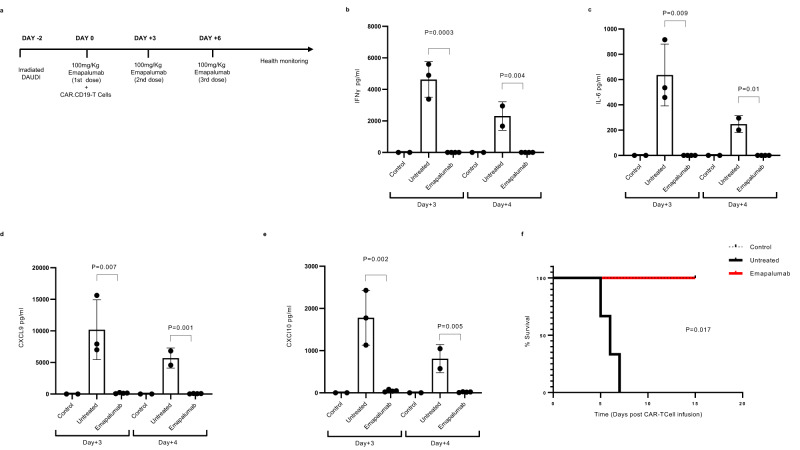
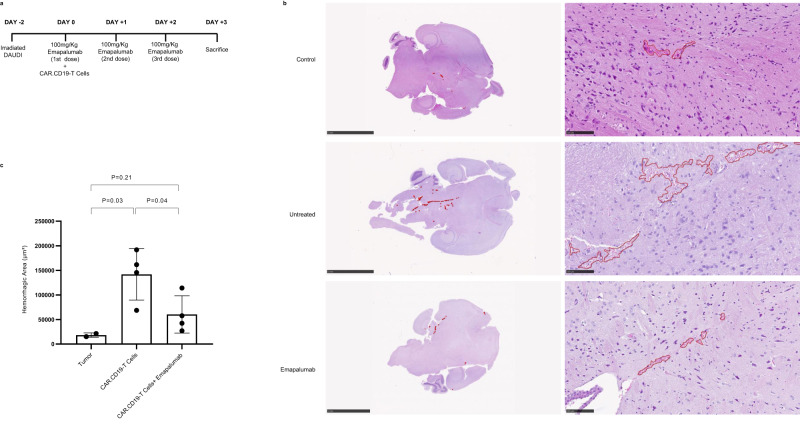
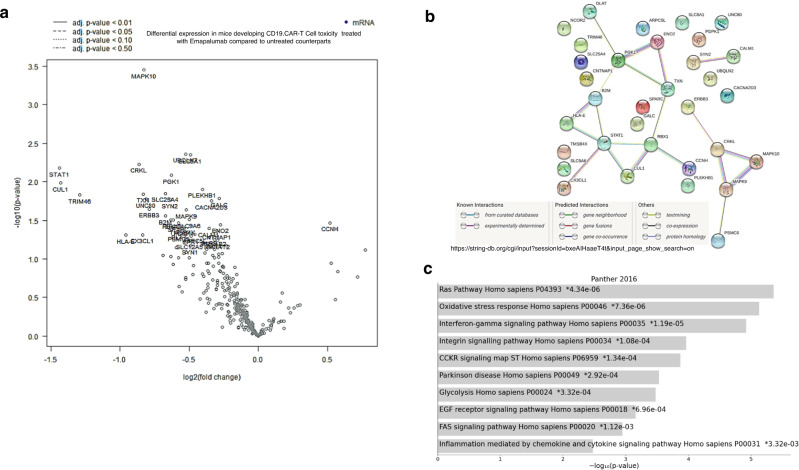
Chimeric antigen receptor T (CAR-T) cell therapy may achieve long-lasting remission in patients with B-cell malignancies not responding to conventional therapies. However, potentially severe and hard-to-manage side effects, including cytokine release syndrome (CRS), neurotoxicity and macrophage activation syndrome, and the lack of pathophysiological experimental models limit the applicability and development of this form of therapy. Here we present a comprehensive humanized mouse model, by which we show that IFNγ neutralization by the clinically approved monoclonal antibody, emapalumab, mitigates severe toxicity related to CAR-T cell therapy. We demonstrate that emapalumab reduces the pro-inflammatory environment in the model, thus allowing control of severe CRS and preventing brain damage, characterized by multifocal hemorrhages. Importantly, our in vitro and in vivo experiments show that IFNγ inhibition does not affect the ability of CD19-targeting CAR-T (CAR.CD19-T) cells to eradicate CD19+ lymphoma cells. Thus, our study provides evidence that anti-IFNγ treatment might reduce immune related adverse effect without compromising therapeutic success and provides rationale for an emapalumab-CAR.CD19-T cell combination therapy in humans.


Conflict of interest statement

F.L. and P.M. declare the following competing interests: on September 2022 participated in an advisory board on primary HLH organized by Sobi, receiving honoraria. All the other authors do not have any competing interests to disclose. SOBI has not supported the study, besides the provision of the emapalumab drug.

Figures

Fig. 1
Fig. 1. Emapalumab does not affect CAR.CD19-T cell in vitro cytotoxicity against Daudi tumor cells.
a NT or CAR.CD19.4-1BB-T cells and GFP+ Daudi cells were plated at the 1:1 E:T ratio in the presence or absence of emapalumab within the concentration range of 0.2–100 μg/ml. After 7 days, FACS analysis was performed to detect GFP+ residual tumor. Data are expressed in percentage, as mean ± SD of 3 independent experiments, with effector cells generated from 3 HDs. Data were compared by a two-tailed Student t-test and p value <0.05 was considered statistically significant. b Heatmaps displaying the IFNγ, Granzyme B, IL-2 and TNF-α levels that are secreted by NT or CAR.CD19.4-1BB-T cells after 24 h of co-culture with Daudi cells in media containing emapalumab within the concentration range of 0–100 μg/ml. Color scale represents cytokine levels as mean of 3 independent experiments with effector cells generated from 3 HDs expressed in percentage. c NT or CAR.CD19.4-1BB-T cells and GFP+ Daudi cells were plated at decreasing E:T ratios, from 1:1 to 1:80 either in the presence or in the absence of 100 μg/ml emapalumab. After 7 days, FACS analysis was performed to detect GFP+ residual tumor cells. Data are expressed in percentage, as mean ± SD of 3 independent experiments with effector cells generated from 3 HDs. Data were compared by a two-tailed Student t-test and p value <0.05 was considered statistically significant. d Real-time kinetics of Daudi elimination exerted by T cells (NT or CAR.CD19.4-1BB) (1:1 E:T ratio) either in the presence or absence of 100 μg/ml emapalumab. The indicated statistical significance refers to the end point of the assay. Data are expressed as mean ± SD of 3 replicates. Data were compared by a two-tailed Student t-test and p value <0.05 was considered statistically significant. e Proliferation of CAR.CD19.4-1BB-T cells activated by Daudi cells and monitored for 3 days in the absence (blue area) or in the presence of 100 μg/ml emapalumab (purple area) compared to CAR-T cells at time of cell plating (day 0, pink area). Exemplificative histograms, relative to one representative experiment, out of the three performed with three different CAR.CD19-T cell donors (p value of the proportion of proliferating CAR.CD19-T cells with vs. without Emapalumab: 0.983). Data are expressed as mean ± SD. Significant p value <0.05. Source data are provided as a Source Data file.
Fig. 2
Fig. 2. Emapalumab does not affect CD28-based CAR.CD19-T cell in vitro cytotoxicity.
a Effector T cells (NT or CAR.CD19.CD28) and GFP+ Daudi cells were plated at decreasing E:T ratios, from 1:1 to 1:2.5 either in the presence or absence of 100 μg/ml emapalumab. At the end of the experiments, tumor cells and T cells were collected and assessed by FACS analysis evaluating the residual GFP+ tumor cells. Data are expressed in percentage, as mean ± SD of 3 independent experiments, with effector cells generated from 3 HDs. Data were compared by a two-tailed Student t-test and p value <0.05 was considered statistically significant. b Heatmaps displaying the IFNγ, Granzyme B, IL-2 and TNF-α levels that are secreted by effector T cells (NT or CD28-based CAR.CD19) after 24 h of co-culture with Daudi cells in media containing emapalumab within the concentration range of 0.2–100 μg/ml. Color scale represents cytokine levels as mean of 3 independent experiments with effector cells generated from 3 HDs expressed in percentage. c Real-time kinetics of Daudi elimination exerted by T cells (NT or CAR.CD19.CD28) (1:1 E:T ratio) either in the presence or absence of 100 μg/ml emapalumab. The indicated statistical significance refers to the end point of the experimental assay. Data are expressed as mean ± SD of 3 replicates. Data were compared by a two-tailed Student t-test and p value <0.05 was considered statistically significant. d Proliferation of CAR.CD19.CD28-T cells activated by Daudi cells and monitored for 3 days in the absence (blue area) or in the presence of 100 μg/ml emapalumab (purple area) compared to CAR-T cells at the time of cell plating (day 0, pink area). Exemplificative histograms, relative to one representative experiment, out of the three performed with three different CAR.CD19-T cell donors (p value of the proportion of proliferating CAR.CD19-T cells with vs. without Emapalumab: 0.957). Student’s t-test was employed to calculate statistically significant differences between groups. Source data are provided as a Source Data file.
Fig. 3
Fig. 3. IFNγ neutralization does not impair CAR.CD19-T cell activation signaling.
a Volcano plot of the 14 deregulated genes in CAR.CD19-T cells activated with 0.5 μg/ml Recombinant Human CD19 Fc Chimera Protein for 16 h in the absence or presence of 100 μg/ml emapalumab. The log2FC indicates the mean expression level for each gene. Genes with negative log2FC are downregulated in CAR.CD19-T cells in the presence of emapalumab. b Heatmap displaying the expression of the same genes in untreated NT-T cells, untreated CAR.CD19-T cells and CAR.CD19-T cells treated with 100 μg/ml emapalumab. c STRING tool has been applied to deconvolute the potential interaction network among the 14 genes deregulated in CAR.CD19-T cells in the presence of emapalumab. d Venn diagram that summarizes common genes deregulated both in untreated CAR.CD19 compared to untreated NT-T cells and in CAR.CD19 cultured either in the presence or absence of emapalumab (untreated CAR.CD19-T cells). e Heatmaps displaying the 7 genes specifically upregulated in activated CAR.CD19-T cells, but deregulated in the presence of emapalumab. Data are obtained from three independent experiments, with effector cells generated from 3 HDs. Source data are provided as a Source Data file.
Fig. 4
Fig. 4. IFNγ neutralization does not affect the activation phenotypic profile of CAR.CD19-T cells.
Phenotypic analysis on different activation markers expressed by T cells (NT or CAR.CD19) after 16 h of co-cultures with Daudi cells either in the presence or absence of 100 μg/ml emapalumab. Data are expressed as mean ± SD and obtained by three independent experiments, with CAR.CD19-T cells generated by three different donors. Student’s t-test was employed to evaluate the statistical relevance of the differences between groups. Data were compared by a two-tailed Student t-test and p value <0.05 was considered statistically significant. Source data are provided as a Source Data file.
Fig. 5
Fig. 5. Emapalumab does not affect CAR.CD19-T cell anti-lymphoma activity in NSG mouse model.
a Schematic representation of the first experimental setting: mice (n = 4 in each cohort) were infused with 0.25 × 106 FF-LUC Daudi cells/mouse at Day-2 and treated with 10 × 106 effector T (NT or CAR.CD19) cells/mouse at Day 0. At Day 7, 11 15 mice received 100 mg/kg emapalumab and were evaluated for lymphoma eradication. b Bioluminescence imaging of each treatment cohort. c Mean ± SD of bioluminescence values of the four mice cohorts over time, receiving only tumor (black dotted line), NT (gray line), CAR.CD19-T cells in the absence of emapalumab (black line) or CAR.CD19-T cells in the presence of emapalumab (red line). d Mean ± SD of bioluminescence values of the four mice cohorts at Day 28. Data were compared by a two-tailed Student t-test and p value <0.05 was considered statistically significant. e Schematic representation of the second experimental setting: mice (n = 4 in each cohort) were infused with 0.25 × 106 FF-LUC Daudi cells/mouse at Day-8 and treated with 10 × 106 effector T (NT or CAR.CD19) cells/mouse at Day 0. At Day 0, 3, 6 mice received 100 mg/kg emapalumab and evaluated for lymphoma eradication. f Bioluminescence imaging of each treatment cohort. g Bioluminescence values of each mouse, receiving NT cells in the absence of emapalumab (red line) or in the presence of emapalumab (red dotted line) or CAR.CD19-T cells in the absence of emapalumab (black line) or CAR.CD19-T cells in the presence of emapalumab (black dotted line). h Mean ± SD of bioluminescence values of the four mice cohorts at Day 15. Data were compared by a two-tailed Student t-test and p value <0.05 was considered statistically significant. Student’s t-test was employed to calculate statistically significant differences between groups. Source data are provided as a Source Data file.
Fig. 6
Fig. 6. Emapalumab displays therapeutic effect in humanized mice developing CRS.
a Schematic representation of the experimental design: hGM-CSF/hIL3 NOG mice were infused with irradiated FF-Luciferase positive sub-acutely irradiated Daudi cells (10 × 106 cells/mouse. n = 10 total humanized mice) at Day-2 and treated with 10 × 106 CAR.CD19-T cells/mouse in the presence of either 100 mg/kg/day emapalumab (n = 4) or vehicle (n = 4). Two mice were considered as for negative control infused only with DAUDI cells. b IFNγ, c IL-6, d CXCL9/MIG and e CXCL10/IP-10 levels were measured on peripheral blood of negative control (n = 2), treated with 10×106 CAR.CD19-T cells/mouse in the presence of either 100 mg/kg/day emapalumab (n = 4) or vehicle (n = 4) mice at Day+3 and Day+4 after effector T-cell infusion. Student’s t-test was employed to calculate statistically significant differences between groups. Data are expressed as mean ± SD. All data above described were compared by a two-tailed Student t-test and p value <0.05 was considered statistically significant. f Kaplan–Meier survival curve analysis of CAR.CD19-T cell-treated mice without emapalumab (black line) or with emapalumab (red line). Source data are provided as a Source Data file.
Fig. 7
Fig. 7. Emapalumab prevents brain injury in humanized mice developing toxicity associated with CAR.CD19-T cells.
a Schematic representation of the experimental design: hGM-CSF/hIL3 NOG mice (n = 10) were infused with irradiated FF-Luciferase positive Daudi cells at Day-2 and treated with 10 × 106 CAR.CD19-T cells/mouse either in the presence of 100 mg/kg/day emapalumab (n = 4) or of the vehicle (n = 4), as reported in the cartoon. Two mice were considered for the negative control, being infused only with DAUDI cells (tumor). b Hematoxylin and eosin staining on brain slides of a control mouse (only tumor; top panels), untreated mouse (tumor and CAR.CD19-T cells in absence of emapalumab; middle panels) and treated mouse (tumor and CAR.CD19-T cells in presence of emapalumab; bottom panels). c Average of the hemorrhagic area in axial brain slide of control mouse (only tumor, n = 2), untreated mouse (tumor and CAR.CD19-T cells in the absence of emapalumab, n = 4) and treated mouse (tumor and CAR.CD19-T cells in the presence of emapalumab, n = 4). Data are expressed as mean ± SD. IHC staining has been performed on five slides from each murine brain. Data were compared by a two-tailed Student t-test and p value <0.05 was considered statistically significant.
Fig. 8
Fig. 8. Gene expression profile associated with glial signaling in humanized mice developing neurotoxicity and treated with emapalumab.
a Volcano plot of the 33 significantly deregulated genes (32 downregulated and one upregulated) in brain tissue sections of mice developing toxicity after CAR-T cell infusion treated with emapalumab or not. The log2FC indicates the mean expression level for each gene. Genes with negative log2FC are downregulated in mice receiving emapalumab. b STRING tool has been applied to deconvolute the potential interaction network among the 32 genes downregulated in brain tissue sections of mice treated with emapalumab, compared to brain tissues from control mice that did not receive the drug. c Gene enrichment analysis performed through the Enrichr web tool displays the pathways in which the 32 genes downregulated in emapalumab-treated mice are involved. For differential expression analysis, a p value of ≤0.05 (calculated with the nSolver™ 4.0 analysis software), was applied as cutoff. Source data are provided as a Source Data file.

References

    1. Lee DW, et al. ASTCT Consensus Grading for cytokine release syndrome and neurologic toxicity associated with immune effector cells. Biol. Blood Marrow Transplant. 2019;25:625–638. doi: 10.1016/j.bbmt.2018.12.758. - DOI - PubMed
    1. Hines MR, et al. Hemophagocytic lymphohistiocytosis-like toxicity (carHLH) after CD19-specific CAR T-cell therapy. Br. J. Haematol. 2021;194:701–707. doi: 10.1111/bjh.17662. - DOI - PMC - PubMed
    1. Hashmi H, et al. Haemophagocytic lymphohistiocytosis has variable time to onset following CD19 chimeric antigen receptor T cell therapy. Br. J. Haematol. 2019;187:e35–e38. doi: 10.1111/bjh.16155. - DOI - PubMed
    1. Shah NN, et al. CD4/CD8 T-cell selection affects chimeric antigen receptor (CAR) T-cell potency and toxicity: updated results from a phase I anti-CD22 CAR T-cell trial. J. Clin. Oncol. 2020;38:1938–1950. doi: 10.1200/JCO.19.03279. - DOI - PMC - PubMed
    1. Hayden PJ, et al. Management of adults and children receiving CAR T-cell therapy: 2021 best practice recommendations of the European Society for Blood and Marrow Transplantation (EBMT) and the Joint Accreditation Committee of ISCT and EBMT (JACIE) and the European Haematology Association (EHA) Ann. Oncol. 2022;33:259–275. doi: 10.1016/j.annonc.2021.12.003. - DOI - PubMed

Publication types