. 2023 Jun 9;14(1):3392.
doi: 10.1038/s41467-023-38467-9.

A multicentric consortium study demonstrates that dimethylarginine dimethylaminohydrolase 2 is not a dimethylarginine dimethylaminohydrolase

Affiliations

A multicentric consortium study demonstrates that dimethylarginine dimethylaminohydrolase 2 is not a dimethylarginine dimethylaminohydrolase

Vinitha N Ragavan et al. Nat Commun. .

Abstract

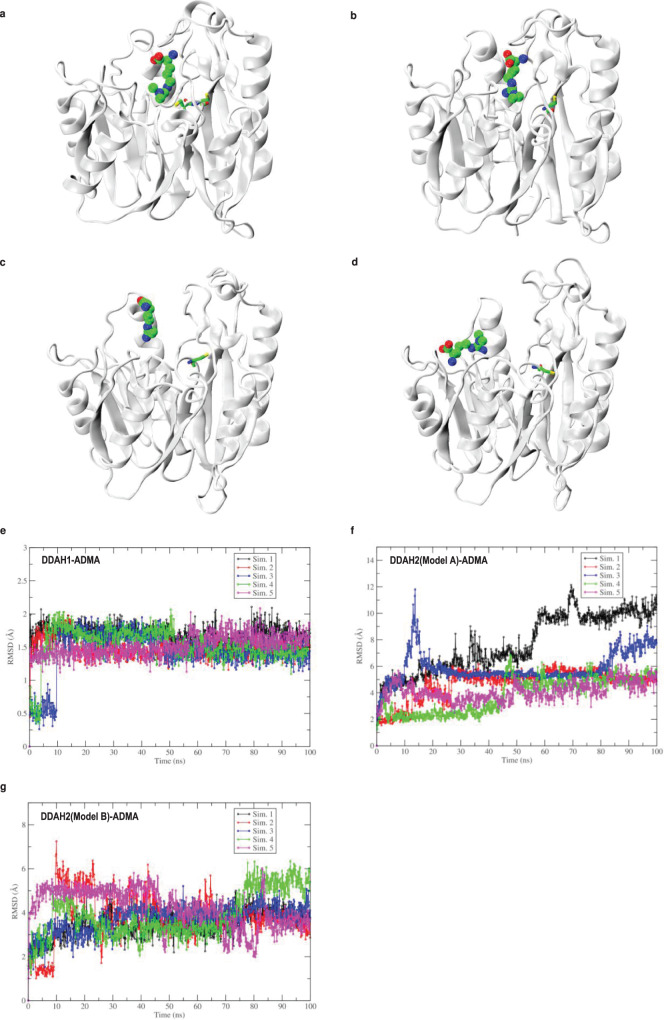
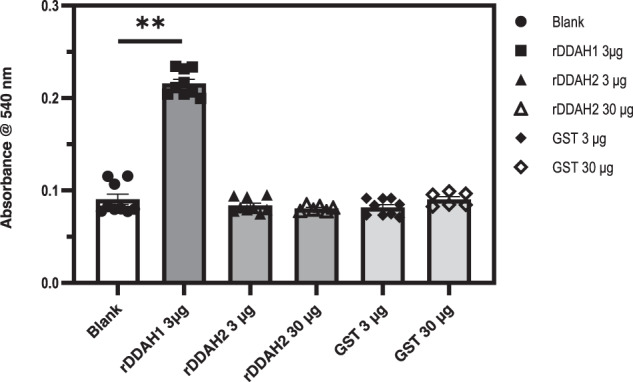
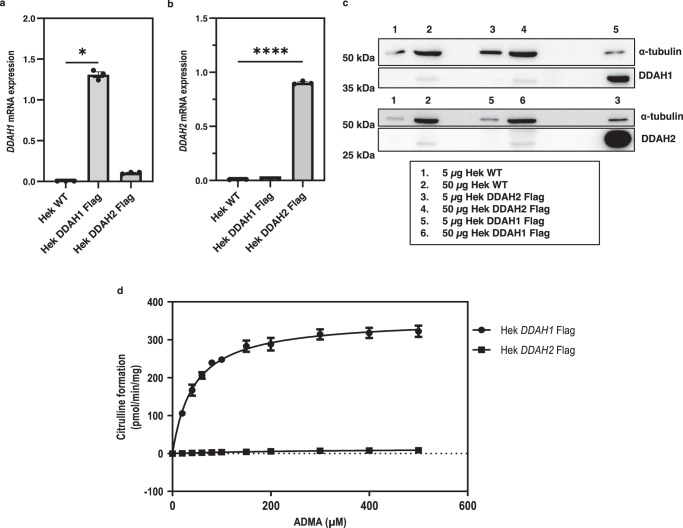
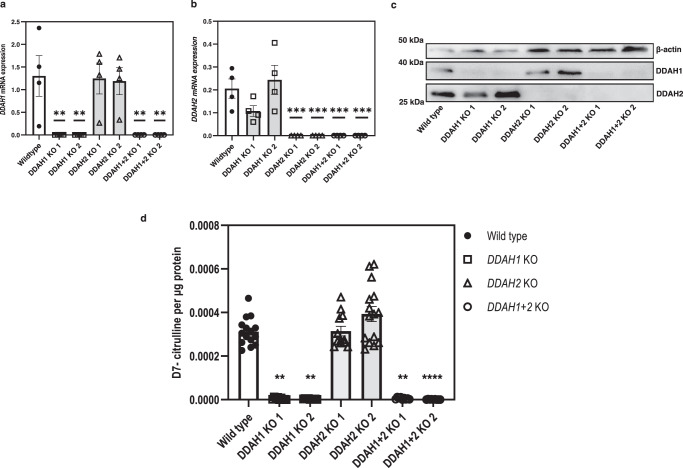
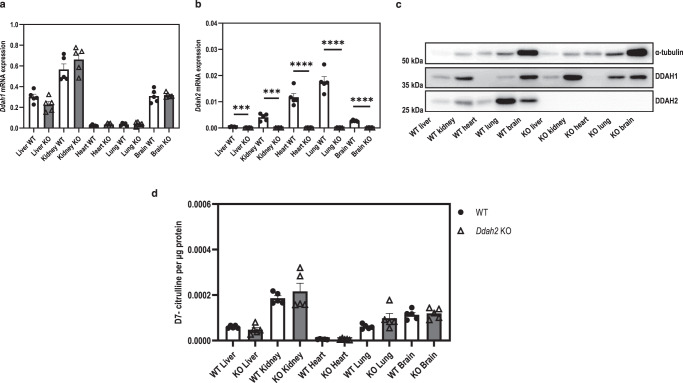
Dimethylarginine dimethylaminohydrolase 1 (DDAH1) protects against cardiovascular disease by metabolising the risk factor asymmetric dimethylarginine (ADMA). However, the question whether the second DDAH isoform, DDAH2, directly metabolises ADMA has remained unanswered. Consequently, it is still unclear if DDAH2 may be a potential target for ADMA-lowering therapies or if drug development efforts should focus on DDAH2's known physiological functions in mitochondrial fission, angiogenesis, vascular remodelling, insulin secretion, and immune responses. Here, an international consortium of research groups set out to address this question using in silico, in vitro, cell culture, and murine models. The findings uniformly demonstrate that DDAH2 is incapable of metabolising ADMA, thus resolving a 20-year controversy and providing a starting point for the investigation of alternative, ADMA-independent functions of DDAH2.


Conflict of interest statement

The authors declare no competing interests.

Figures

Fig. 1
Fig. 1. Comparison of the 3D structures of DDAH1 and DDAH2.
a Structural overlay of DDAH1 X-ray structure 2JAI (magenta) and DDAH2 homology models (green, cyan) (cartoon). DDAH1 superimposed to DDAH2 Model A and B have a root mean square deviation (RMSD) of 0.12 Å and 0.76 Å, respectively, while the superimposed DDAH2 Model A to Model B has a RMSD of 0.78 Å (PyMol). b Catalytic triad of DDAH1 binding site (residue numbering from Leiper et al.). c Residues at the equivalent position in DDAH2 site SWISS-MODEL (Model A, green). d Residues at the equivalent position in DDAH2 site AlphaFold (Model B, cyan).
Fig. 2
Fig. 2. Molecular dynamics study of DDAH proteins.
a Binding mode of ADMA in DDAH1-active site (average conformation) (cartoon), Cys273 and Cy274 are shown in sticks. Binding mode of ADMA in DDAH2 (Model A, cartoon) binding site at (b) 0 ns (start of simulations), (c) 40 ns, and (d) 100 ns. In DDAH2 structure, Cys276 (equivalent of Cy274 in DDAH1) is shown in sticks. Root mean square deviation (RMSD) of ADMA bound to DDAH proteins from five independent molecular dynamics simulations of individual DDAH-ADMA complexes (represented as Sim. 1–5), ADMA bound to (e) DDAH1, (f) DDAH2 (Model A), and (g) DDAH2 (Model B). Sim. simulation. Source data are provided as a Source Data file.
Fig. 3
Fig. 3. Titration curves of ADMA to DDAH1-GST, DDAH2-GST, and GST as resulting from the MST binding experiments.
A stable binding event occurs only in the case of ADMA to DDAH1-GST (green). Conversely, variations in the amplitude and in the signal-to-noise ratio compared to background noise are below the accepted threshold values for the binding event of ADMA to DDAH2-GST (magenta). No binding event is obtained in assessing the interaction of ADMA to GST (cyan) protein domain. Data (n = 3 technical replicates) are presented as mean ± SD. Source data are provided as a Source Data file.
Fig. 4
Fig. 4. L-citrulline formation by recombinant DDAH.
Recombinant DDAH and GST proteins were incubated with 10 mM ADMA, and the enzymatic activity was measured by detection of L-citrulline production. The DDAH specific enzymatic activity of rDDAH1 was 17.10 ± 0.4 (pmoles/min/µg ± SD). The experiments with recombinant DDAH2 30 µg and GST 30 µg were performed twice while the remaining experiments with the other conditions were performed three times. Kruskal–Wallis test with Dunn’s multiple comparison test to the blank was performed. n = 9 for Blank, 3 µg GST protein, 3 µg rDDAH1, 3 µg rDDAH2; n = 6 for 30 µg GST protein, 30 µg rDDAH2 (technical replicates). Data are presented as mean ± SD. **p < 0.01 (p = 0.0035). Source data are provided as a Source Data file.
Fig. 5
Fig. 5. ADMA metabolism by HEK293T cells overexpressing DDAH1 and DDAH2.
ac mRNA and protein expression of HEK293T cells stably transfected with DDAH1 or DDAH2 in comparison to wild-type cells. d HEK293T cells with DDAH1 or DDAH2 overexpression were used to measure citrulline formation, a product of ADMA metabolism, at increasing substrate concentrations. Kruskal–Wallis test with Dunn’s multiple comparison test to the wild-type cell line was performed for DDAH1 mRNA expression analysis while one-way ANOVA with multiple comparisons to the wild-type cell line was performed for DDAH2 mRNA expression analysis (n = 3 biological replicates). DDAH activity assay using ADMA performed with n = 3 and n = 2 (biological replicates) respectively for DDAH1 and DDAH2 HEK293T cell models. Data are presented as mean ± SE. a *p < 0.001 (p = 0.0146); b ****p < 0.0001 (p < 0.000001). Source data are provided as a Source Data file.
Fig. 6
Fig. 6. DDAH activity assay of lysates from wild type and DDAH knockout MDA-MB-231 cells using D7-labelled ADMA as substrate.
a, b mRNA expression of both DDAH1 and DDAH2, respectively, in the cell lines. c Representative Western blot image of MDA-MB-231 wild-type cells and the respective DDAH knockout clones. d Levels of D7-labelled citrulline produced by metabolism of D7-labelled ADMA. Data from the DDAH1 and DDAH2 mRNA expression analyses were collected from four experiments (n = 4 biological replicates) and one-way ANOVA statistical analyses with comparison to the wild-type group was performed for the normally distributed data. Data from the DDAH activity assay was collected from at least three experiments, performed in triplicate (MDA-MB-231 wild-type, DDAH2 KO 1, and DDAH2 KO 2 n = 15; DDAH1 KO 1, DDAH1 KO 2, DDAH1 + 2 KO 1, and DDAH1 + 2 KO 2 n = 9, biological replicates). Statistical analysis was performed by Kruskal–Wallis test for non-normally distributed data, with Dunn’s multiple comparison to the wild-type cell line. Outliers were removed based on Grubbs (DDAH2 KO 1 n = 3). Data are presented as mean ± SE. a **p < 0.01 (p = 0.006); b ***p < 0.001 (p = 0.00057); d **p < 0.01 (DDAH1 KO 1 p = 0.0013, DDAH1 KO 2 p = 0.0014, DDAH1 + 2 KO 1 p = 0.0078), ****<0.0001 (p = 0.000007). Source data are provided as a Source Data file.
Fig. 7
Fig. 7. DDAH activity assay of lysates from control and shRNA DDAH knockdown HUVECs using D7-labelled ADMA as substrate.
a, b mRNA expression of both DDAH1 and DDAH2, respectively, in the cell lines. c Representative Western blot image of control and DDAH shRNA knockdown clones. d Levels of D7-labelled citrulline produced by metabolism of D7-labelled ADMA. Statistical analysis was performed using one-way ANOVA with comparisons to the control shRNA group (n = 3 biological replicates). Data are presented as mean ± SE. a *p < 0.05 (p = 0.0464); b *p < 0.05 (p = 0.0272), ***p < 0.001 (p = 0.0009). Source data are provided as a Source Data file.
Fig. 8
Fig. 8. DDAH activity assay of tissues from wild type and Ddah1 knockout mice.
a, b mRNA expression of DDAH isoforms in tissues of wild type and Ddah1 knockout mice. c Representative Western blot image of protein expression in tissue lysates from wild type and Ddah1 knockout mice. d Level of D7-labelled citrulline produced from the metabolism of D7-labelled ADMA by tissues of wild type and Ddah1 knockout mice. Statistical analyses were performed by unpaired two-sided Mann–Whitney test for non-normally distributed data with comparisons to the wild-type group for each tissue type (n = 5 biological replicates). Outliers were removed by ROUT method (Ddah1 KO liver, Ddah1 KO kidney, n = 1 from Ddah1 mRNA expression analysis). Data are presented as mean ± SE. a *p < 0.05 (p = 0.0159), **p < 0.01 (p = 0.0079), ***p < 0.001 (heart p = 0.0003, lung p = 0.0006); d **p < 0.01 (p = 0.0079). Source data are provided as a Source Data file.
Fig. 9
Fig. 9. DDAH activity assay of tissues from wild type and Ddah2 knockout mice.
a, b mRNA expression of DDAH isoforms in tissues of wild type and Ddah2 knockout mice. c Representative Western blot image of protein expression in tissue lysates from wild type and Ddah2 knockout mice. d Level of D7-labelled citrulline produced from the metabolism of D7-labelled ADMA by tissues of wild type and Ddah2 knockout mice. Statistical analysis was performed using two-sided unpaired t-test for normally distributed data (a, b) and unpaired two-sided Mann–Whitney test for non-normally distributed data (d), with comparisons to the wild-type group of each tissue type (n = 5 biologically replicates). Data are presented as mean ± SE. ***p < 0.001 (p = 0.0001), ****p < 0.0001. Source data are provided as a Source Data file.

References

    1. Moncada S, Higgs A. The L-arginine-nitric oxide pathway. N. Engl. J. Med. 1993;329:2002–2012. doi: 10.1056/NEJM199312303292706. - DOI - PubMed
    1. Moncada S, Bolanos JP. Nitric oxide, cell bioenergetics and neurodegeneration. J. Neurochem. 2006;97:1676–1689. doi: 10.1111/j.1471-4159.2006.03988.x. - DOI - PubMed
    1. Alderton WK, Cooper CE, Knowles RG. Nitric oxide synthases: structure, function and inhibition. Biochem. J. 2001;357:593–615. doi: 10.1042/bj3570593. - DOI - PMC - PubMed
    1. Förstermann U, Sessa WC. Nitric oxide synthases: regulation and function. Eur. Heart J. 2012;33:829–837d. doi: 10.1093/eurheartj/ehr304. - DOI - PMC - PubMed
    1. Tran CTL, Leiper JM, Vallance P. The DDAH/ADMA/NOS pathway. Atheroscler. Suppl. 2003;4:33–40. doi: 10.1016/S1567-5688(03)00032-1. - DOI - PubMed

Publication types