. 2023 Jun 9;14(1):3403.
doi: 10.1038/s41467-023-39040-0.

Variants in SART3 cause a spliceosomopathy characterised by failure of testis development and neuronal defects

Affiliations

Variants in SART3 cause a spliceosomopathy characterised by failure of testis development and neuronal defects

Katie L Ayers et al. Nat Commun. .

Erratum in

  • Author Correction: Variants in SART3 cause a spliceosomopathy characterised by failure of testis development and neuronal defects.
    Ayers KL, Eggers S, Rollo BN, Smith KR, Davidson NM, Siddall NA, Zhao L, Bowles J, Weiss K, Zanni G, Burglen L, Ben-Shachar S, Rosensaft J, Raas-Rothschild A, Jørgensen A, Schittenhelm RB, Huang C, Robevska G, van den Bergen J, Casagranda F, Cyza J, Pachernegg S, Wright DK, Bahlo M, Oshlack A, O'Brien TJ, Kwan P, Koopman P, Hime GR, Girard N, Hoffmann C, Shilon Y, Zung A, Bertini E, Milh M, Ben Rhouma B, Belguith N, Bashamboo A, McElreavey K, Banne E, Weintrob N, BenZeev B, Sinclair AH. Ayers KL, et al. Nat Commun. 2023 Jun 15;14(1):3566. doi: 10.1038/s41467-023-39372-x. Nat Commun. 2023. PMID: 37322043 Free PMC article. No abstract available.

Abstract

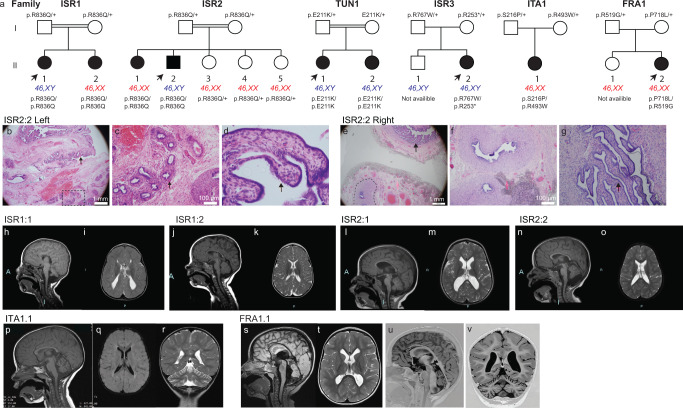
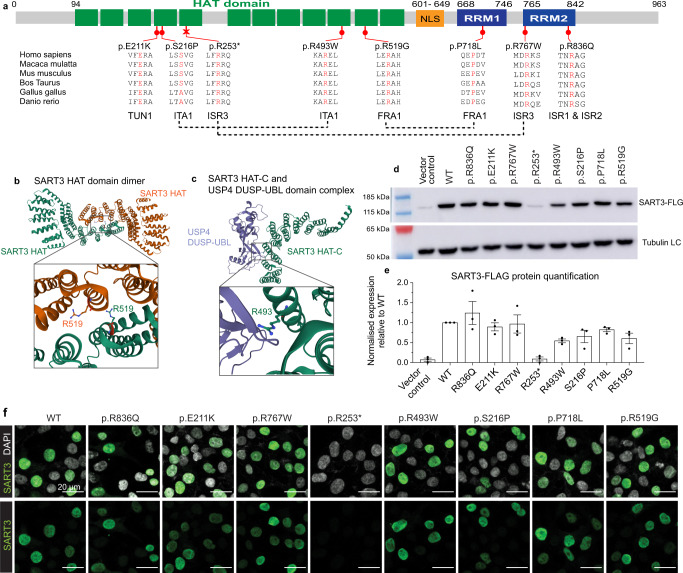
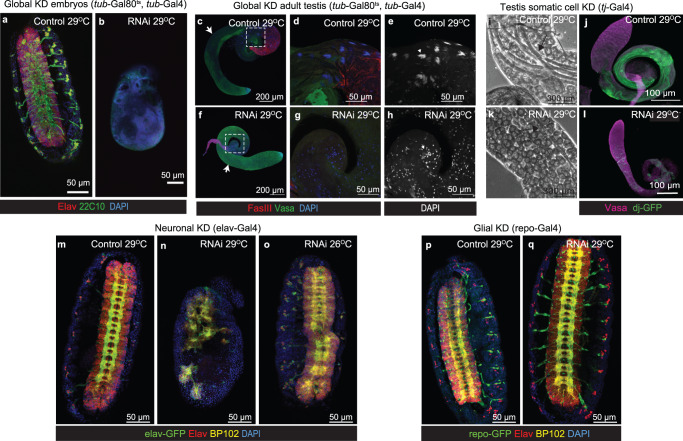
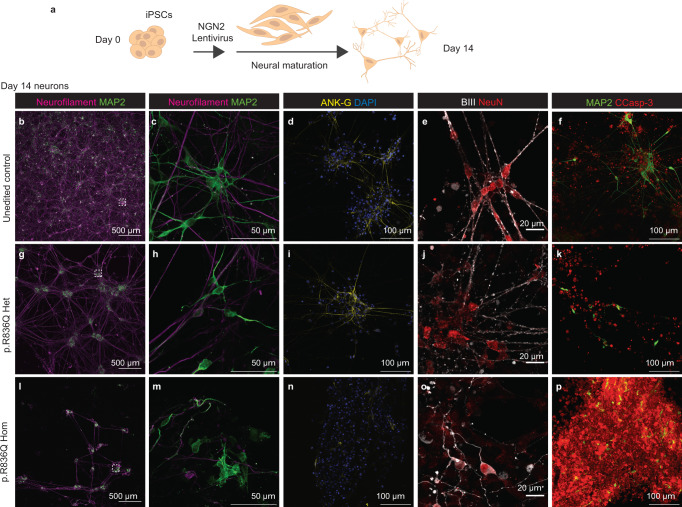
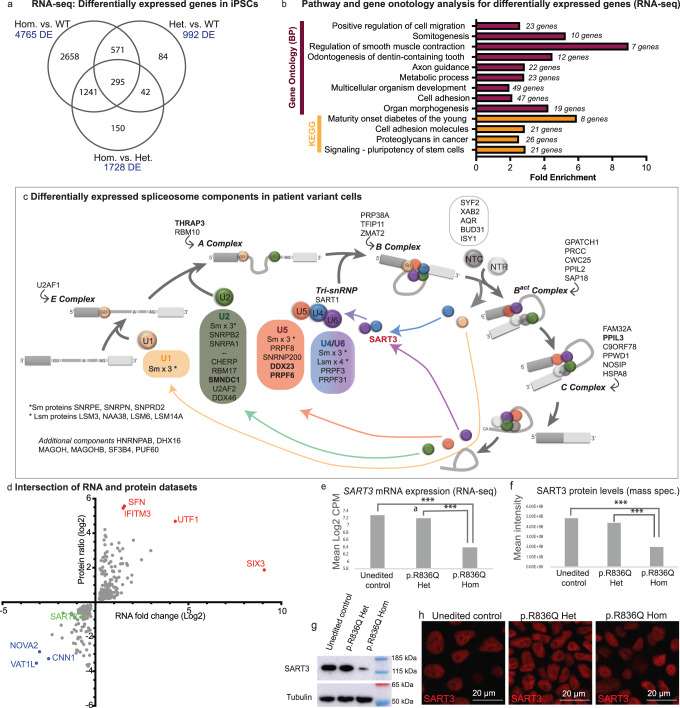
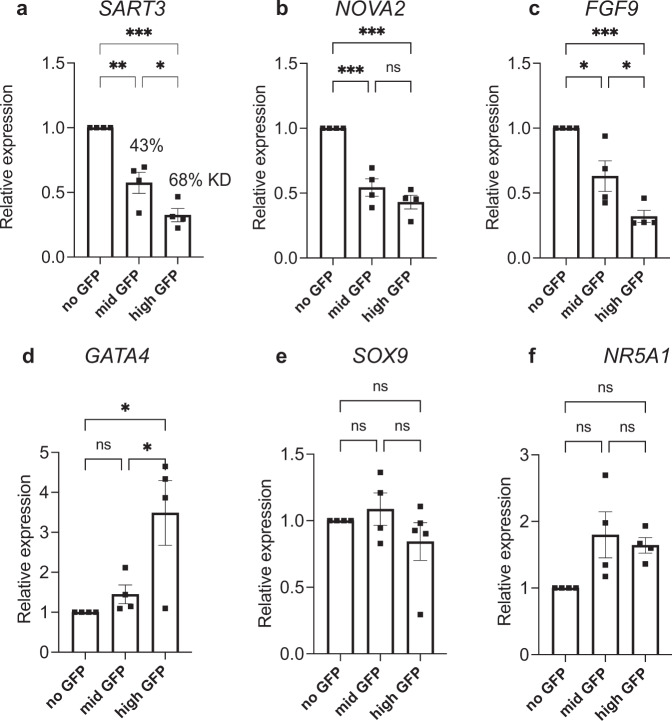
Squamous cell carcinoma antigen recognized by T cells 3 (SART3) is an RNA-binding protein with numerous biological functions including recycling small nuclear RNAs to the spliceosome. Here, we identify recessive variants in SART3 in nine individuals presenting with intellectual disability, global developmental delay and a subset of brain anomalies, together with gonadal dysgenesis in 46,XY individuals. Knockdown of the Drosophila orthologue of SART3 reveals a conserved role in testicular and neuronal development. Human induced pluripotent stem cells carrying patient variants in SART3 show disruption to multiple signalling pathways, upregulation of spliceosome components and demonstrate aberrant gonadal and neuronal differentiation in vitro. Collectively, these findings suggest that bi-allelic SART3 variants underlie a spliceosomopathy which we tentatively propose be termed INDYGON syndrome (Intellectual disability, Neurodevelopmental defects and Developmental delay with 46,XY GONadal dysgenesis). Our findings will enable additional diagnoses and improved outcomes for individuals born with this condition.


Conflict of interest statement

K.R.S. is currently an employee of AstraZeneca and own shares in the company. Their contribution to this article predated her employment at AstraZeneca. The remaining authors declare no competing interests.

Figures

Fig. 1
Fig. 1. Bi-allelic variants in SART3 are associated with a syndrome characterised by developmental delay, intellectual disability and 46,XY-specific gonadal dysgenesis.
a The pedigrees of six families with affected children carrying bi-allelic SART3 variants. Arrows = probands. Both genetic sex (XX or XY) and gender (circle = female, square = male) are indicated. Families ISR1, ISR2 and TUN1 have homozygous variants. Families ISR3, ITA1, FRA1 have compound heterozygous variants. bg Gonad histology in ISR2.2. b The left testis, resected at 9 months, was fibrotic. Both epididymis (box) and fallopian tube (arrow) were present. c Enlarged views of the left epididymis (insert from b) and d fallopian tube (arrow). e Histology of the right testis, resected at age 5, demonstrated widespread fibrosis and the presence of epididymis (dotted line) and fallopian tube (arrow). f Higher magnification of the epididymis, and g the fallopian tube. hv MRI imaging. T1-weighted midline sagittal images demonstrating thin corpus callosum in j ISR1.2, l ISR2.1, n ISR2.2, p ITA1.1 and FRA1.1 (s and u, inversion recovery image 0.9 mm thick), and h absent corpus callosum in ISR1.1. Atrophy of the cerebellar vermis is observed in h ISR1.1, l ISR2.1, n ISR2.2 and in p ITA1.1. s, u In FRA1.1, sagittal imaging also revealed vermis atrophy, enlargement of the 4th ventricle, cisterna magna and hypoplastic pons. T2-weighted axial images at the level of the lateral ventricles demonstrated delayed myelination and atrophy of the white matter and ragged configuration of the posterior horn of the lateral ventricle in k ISR1.2, m ISR2.1 and o ISR2.2. r Coronal section for ITA1.1 shows cerebellar atrophy with q axial inversion recovery image showing mild ventriculomegaly. i ISR1.1 has colpocephaly with decreased white matter volume. t Axial T2-weighted image in FRA1.1 demonstrates ventriculomegaly with square-shaped frontal horns. v Atrophy of the cerebellar hemispheres is also observed in a coronal inversion recovery image. A anterior.
Fig. 2
Fig. 2. SART3 variants map to conserved domains and residues.
a SART3 is a 963 amino acid protein containing 12 half-a-tetratricopeptide (HAT) repeats (the HAT domain, green), a nuclear localisation signal (NLS, yellow) and two RNA recognition motifs (RRM1 and RRM2, blue). Positions of SART3 variants are shown in red. Variants show amino acid conservation between vertebrate species. b Crystal structure of human SART3 HAT domains as a dimer (PDB ID 5CTQ) with Arginine 519 highlighted on each chain. c Crystal structure of human SART3 HAT-C domain-human USP4 DUSP-UBL domain complex (PDB ID 5CTR) with Arginine 493 highlighted. Crystal structures were visualised in the RCSB PDB 3D protein viewer (Mol*). d Western blot analysis of WT and variant pCMV-SART3-FLAG constructs transiently transfected in HEK293t cells with an anti-FLAG antibody and beta-tubulin loading control (LC). e Quantification of western blot SART3-FLAG (FLG) levels, normalised to the beta-Tubulin LC and relative to WT. Data is represented as mean ± SEM from n = 3 independent experiments. Significant was calculated using a one-way ANOVA with Dunnett’s multiple comparison (P values = *<0.05; **<0.01; ***<0.001). The p.R253* variant shows a significant drop in expression (P value = 0.001). Raw data and uncropped blots are provided in a source data file. f Immunofluorescence analysis of WT and variant pCMV-SART3-FLAG constructs transiently transfected in HEK293t cells using a SART3 antibody. WT and missense variants showed nuclear localisation. The truncating variant (p.R253*) was not detected with the SART3 or FLAG antibody (Supplementary Fig. 2).
Fig. 3
Fig. 3. SART3 is a conserved regulator of embryonic CNS and testis development.
a, b Stage 16 Drosophila embryos stained with CNS markers Elav (red; pan-neuronal), 22C10 (green; neuronal cell bodies and axons), and DAPI (blue; nuclei). a w1118 crossed control embryos. b Global Rnp4f KD using the tubulin-Gal4; tubulin-Gal80 temperature sensitive driver (tub-Gal4, tub-GAL80ts) to express RNAi at the permissive temperature of 29 °C. Significant embryonic lethality and disrupted CNS development was observed. ce Control and fh tub-Gal4, tub-GAL80ts, RNAi adult male testes stained for Vasa (green; germ cells), Fasciclin 3 (FasIII, red; hub) and DAPI (blue; spermatid bundles). c Vasa stains germs cells from stem cell to spermatogonia stages and is strongest in earlier germ cell populations with round spermatocytes and spermatids visualised by reduced intensity (arrow). f Testes from tub-Gal4, tub-GAL80ts, RNAi males have uniform Vasa expression, suggesting a loss of round spermatocytes and spermatids (f, arrow). d, e Higher magnification of insert from c showing DAPI-positive spermatid bundles in the control (arrowhead). g, h Higher magnification of insert from f showing KD testes had no spermatid bundles. il Day 14 testis from i, j controls and k, l Rnp4f KD using a testicular somatic cell driver, traffic jam-Gal4 (tj-Gal4). i Phase contrast image showing spermatid bundles in the control (arrow). j Control testis expressing the Don Juan-GFP reporter for elongated spermatids (green) and stained for Vasa (magenta; germ cells). k Somatic cell KD testes accumulate earlier germ cell stages and have less spermatid bundles. l They also lose elongated spermatids. mo Stage 16 Drosophila embryos expressing elav-GFP (green; pan-neuronal marker) stained with anti-Elav (red), anti-BP102 (yellow; axons) and DAPI (blue). n Neuronal-specific KD (elav-Gal4, UAS-GFP) led to embryonic lethality and midline CNS defects at 29 °C compared to m control. o Less severe defects were observed at 26 °C, where RNAi expression is lower. p, q Stage 16 Drosophila embryos with glial-specific expression (repo-Gal4, UAS-GFP) stained for Elav (red), BP102 (yellow) and DAPI (blue). p No embryonic defects were found in w118-crossed control or q KD at 29 °C. b, fh, n, o, q are examples of KD using RNAi-B and k, l are using RNAi-V. Additional examples provided in Supplementary Fig. 3.
Fig. 4
Fig. 4. SART3 is expressed in human foetal gonads, and patient variants lead to disrupted differentiation into gonad-like organoids.
ad 9 weeks + 2 days gestation human embryonic testis stained for b AMH (Sertoli cells, magenta) and c OCT4 (germ cells, red). d SART3 (green) has speckled nuclear and cytoplasmic expression in all cell types. a is an overlay with DAPI (nuclei, blue). e Method for gonadal-like organoid differentiation. f Organoid size (diameter) at day 14 and day 21. Individual data points are from organoids from three separate differentiations, with mean represented by a dash. n = 10 for day 14 control, day 14 heterozygous, day 21 heterozygous. n = 8 for day 14 homozygous. n = 11 for day 21 control and day 21 homozygous. Significance was calculated using one-way ANOVA with Tukey’s multiple comparison test. P values = *< 0.05; **<0.01; ***<0.001. Homozygous SART3 variant organoids were smaller at both timepoints (day 14 P < 0.001, day 21 P = 0.002). gx Immunostaining of day 21 organoids from gi control iPSCs, mr heterozygous SART3 p.Arg836Gln or sx homozygous SART3 p.Arg836Gln iPSCs. g, m, s Testis Sertoli cell marker SOX9 (green) was observed in tubular structures in all lines. h, n, t Gonadal marker GATA4 (red) was also expressed. ik, oq, uw Higher magnification images show SOX9 (green) expressing cells inside Collagen IV (COLIV, magenta) positive tubular structures. l, r, x Cleaved Caspase-3 staining (apoptosis, yellow) was elevated in the x homozygous variant organoids compared compared to l control or r heterozygous organoids. An insert shows CCas-3 staining outside of tubular structures (x, blue dashed line). y RT-qPCR of gene markers during the differentiation. OCT4 is a pluripotency marker. PAX2 is a marker of the intermediate mesoderm. NR5A1 and GATA4 are bi-potential gonad markers. FGF9, SOX9 and CLDN11 are Sertoli cell markers. At each timepoint n = nine wells or organoids from three independent differentiations. Data presented as mean ± SEM relative to day 0 control. A two-way ANOVA followed by Tukey’s multiple comparison test was performed to compare cell lines at each timepoint. Asterisk represents a significant difference from control line (P values = *<0.05; **<0.01; ***<0.001).
Fig. 5
Fig. 5. iPSCs carrying SART3 patient variant p.Arg836Gln show disrupted differentiation into neurons in vitro.
a Overview of NGN2 protocol for differentiation of iPSCs into cortical neurons. bp Day 14 neurons stained for various neuronal markers. b, g, l Neurofilament staining (axons, magenta) and MAP2 (dendrites, green) staining illustrates networks, with higher magnification of inserts shown in c, h, m. d, i, n Ankyrin-G (ANK-G, axon initial segment, yellow) and DAPI (blue). e, j, o β-III tubulin (BIII, axons dendrites and soma, white) with NeuN (neural soma, red). f, k, p MAP2 (dendrites, green) and cleaved Caspase-3 (CCasp-3, apoptosis, red). bNeurons derived from control unedited iPSCs and gh heterozygous SART3 p.Arg836Gln iPSCs form dense networks) and show expression of b, c, g, h, f, MAP2, d, i ANK-G, e, j BIII and NeuN. lp Homozygous SART3 p.Arg836Gln neurons are sparser, n show reduced expression of ANK-G and have m, o disrupted morphology. f, k, p Cleaved Caspase-3 staining indicates increased apoptosis in the p homozygous variant line compared to the control or k heterozygous line.
Fig. 6
Fig. 6. The patient variant p.Arg836Gln disrupts numerous signalling pathways and leads to reduced SART3 RNA and protein levels.
RNA-seq and MS analysis of heterozygous, homozygous p.Arg836Gln variant or non-edited control iPSCs. a A Venn diagram of differentially expressed (DE) genes between groups (FDR < 0.05). b Number of DE genes is shown in blue for each comparison KEGG and Gene Ontology (biological process) pathway analysis identified 13 pathways/gene ontologies with significant enrichment (P < 0.05 adjusted for multiple comparisons, Benjamini Hochberg FDR) represented in the topmost DE genes between control and homozygous iPSCs (1000 genes based on FDR). c A schematic of the major spliceosome. SART3 (red) has been implicated in recycling U4 and U6 snRNAs. Components that are DE in variant iPSCs are shown (RNA-seq or MS. Bold text = both with change in same direction). d Intersection of the DE genes (FDR < 0.05) and proteins (FDR < 0.05) revealed a significant overlap (P < 10−9, one-sided Fischer’s Exact Test) with 350 genes/proteins DE in the same direction in both datasets (plotted as log2 ratio/fold change). Genes/proteins with the highest upregulation (red) or downregulation (blue) are shown. SART3 is downregulated in the homozygous variant cells (green). e SART3 expression from RNA-seq (mean log2 counts per million, CPM) *** = FDR = 1.52E-05 and 1.45E-04 respectively. Downregulation was confirmed by RT-qPCR – see Supplementary Fig. 6i. f MS found a significant difference in SART3 protein levels in homozygous iPSC line compared to control (***P = 3.77E-05), or heterozygous line (***P = 1.11E-04). g This was confirmed in western blot analysis – see also Supplementary Fig. 5p. h SART3 staining is nuclear in all three lines. RNA-seq and proteomic data analysis is provided in Supplementary Data 2.
Fig. 7
Fig. 7. Knockdown of SART3 in NT2/D1 cells highlights potential interaction between SART3, NOVA2 and gonadal pathway genes.
ad shRNA mediated KD of SART3 in GFP-sorted NT2/D1 cells. a Mid and high GFP cells had 43 and 68% KD of SART3 mRNA respectively compared to non-GFP control cells, as determined by RT-qPCR. b NOVA2 mRNA levels correlated with SART3 KD. c FGF9 levels were also reduced, and d GATA4 expression was higher in KD cells. e SOX9 and f NR5A1 expression were not significantly different in KD cells. Expression is relative to the non-GFP control and shown as mean ± SEM. n = 4 independent experiments. A one-way ANOVA with Tukey’s multiple comparison test was used. P values are *<0.05; **<0.01; ***<0.001.

References

    1. Lee, P. A., Houk, C. P., Ahmed, S. F., Hughes, I. A. & International Consensus Conference on Intersex organized by the Lawson Wilkins Pediatric Endocrine Society and the European Society for Paediatric Endocrinology. in Pediatrics. Vol. 118. p. e488-e500 (American Academy of Pediatrics, 2006).
    1. Berglund A, et al. Incidence, prevalence, diagnostic delay, and clinical presentation of female 46,XY disorders of sex development. J. Clin. Endocrinol. Metab. 2016;101:4532–4540. doi: 10.1210/jc.2016-2248. - DOI - PubMed
    1. Michala L, Goswami D, Creighton SM, Conway GS. Swyer syndrome: presentation and outcomes. BJOG. 2008;115:737–741. doi: 10.1111/j.1471-0528.2008.01703.x. - DOI - PubMed
    1. Eggers S, et al. Disorders of sex development: insights from targeted gene sequencing of a large international patient cohort. Genome Biol. 2016;17:243. doi: 10.1186/s13059-016-1105-y. - DOI - PMC - PubMed
    1. Baxter RM, et al. Exome sequencing for the diagnosis of 46,XY disorders of sex development. J. Clin. Endocrinol. Metab. 2015;100:333–344. doi: 10.1210/jc.2014-2605. - DOI - PMC - PubMed

Publication types