. 2023 Jun 9;14(1):3240.
doi: 10.1038/s41467-023-38704-1.

A village in a dish model system for population-scale hiPSC studies

Affiliations

A village in a dish model system for population-scale hiPSC studies

Drew R Neavin et al. Nat Commun. .

Abstract

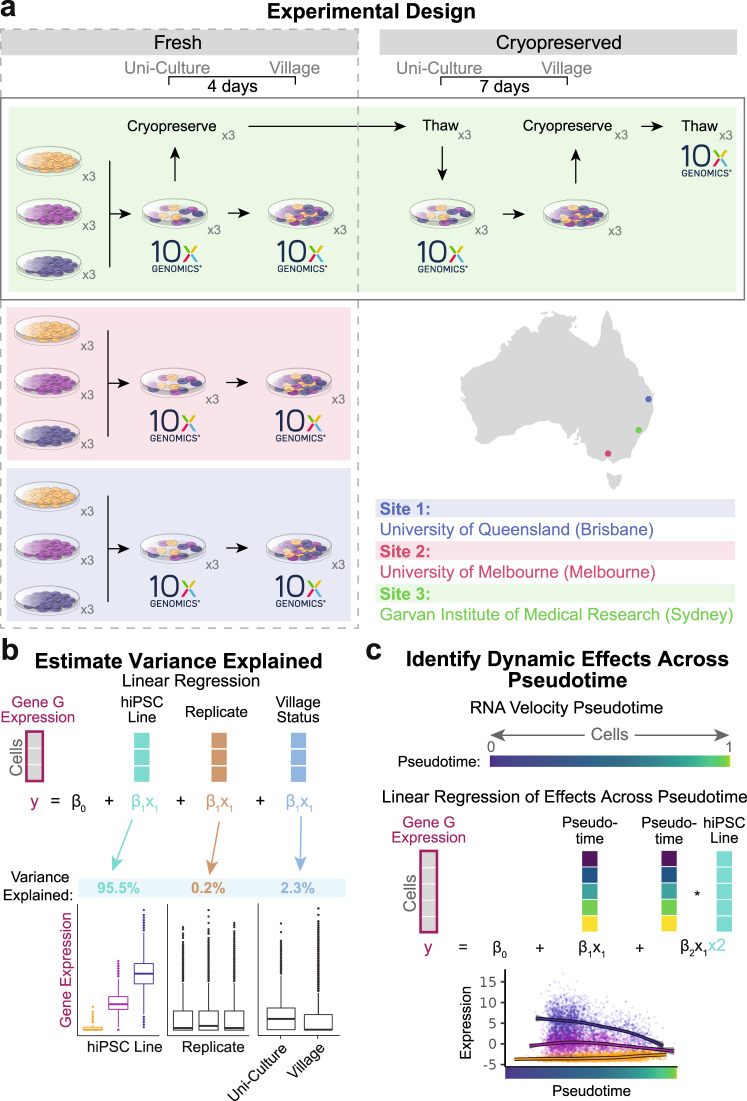
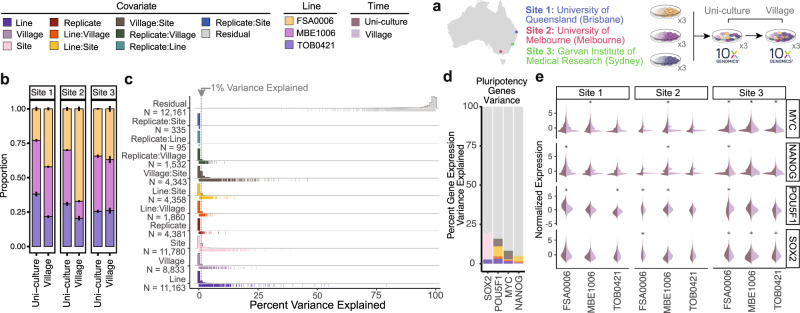
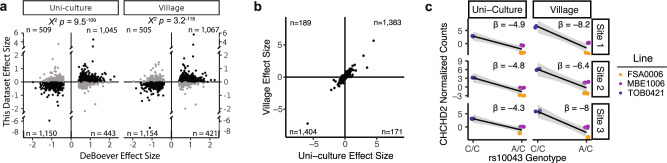
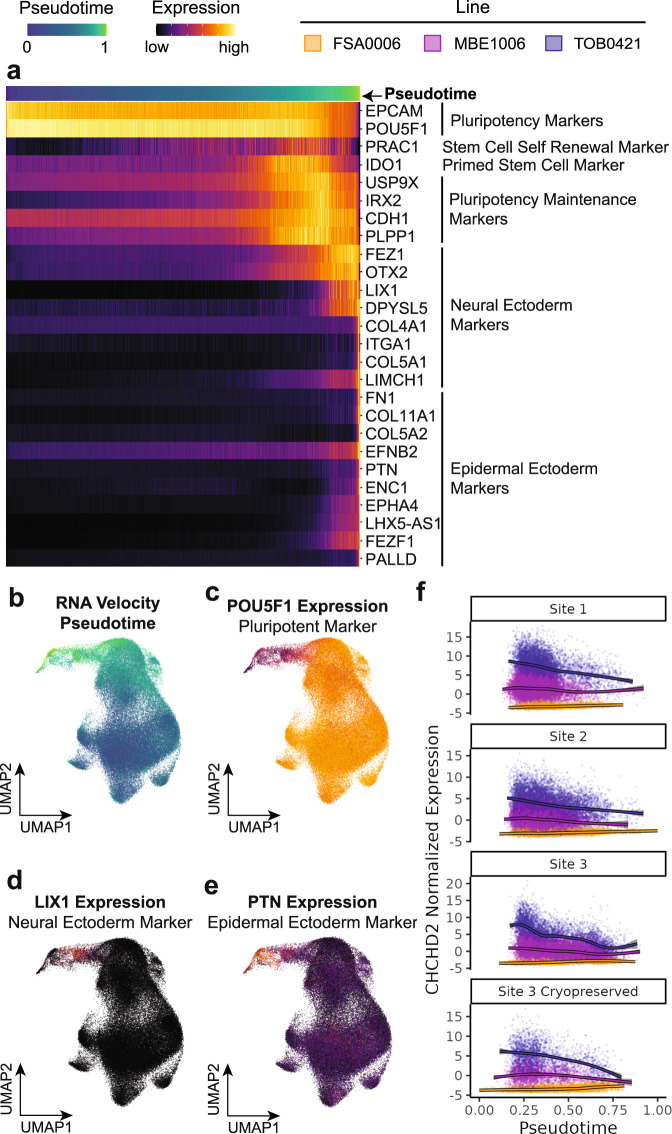
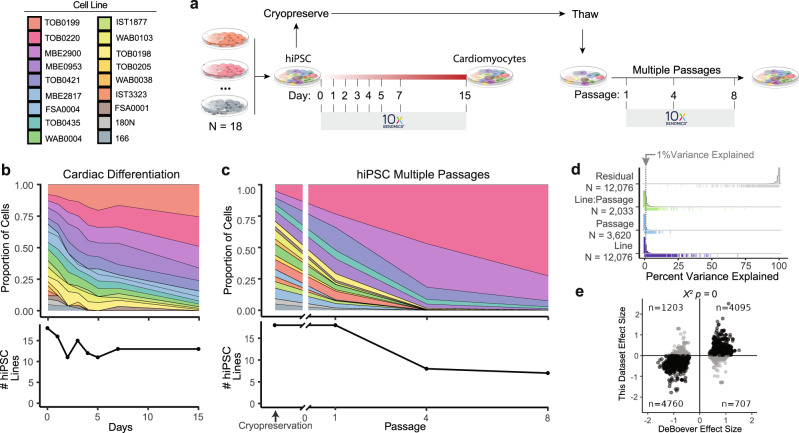
The mechanisms by which DNA alleles contribute to disease risk, drug response, and other human phenotypes are highly context-specific, varying across cell types and different conditions. Human induced pluripotent stem cells are uniquely suited to study these context-dependent effects but cell lines from hundreds or thousands of individuals are required. Village cultures, where multiple induced pluripotent stem lines are cultured and differentiated in a single dish, provide an elegant solution for scaling induced pluripotent stem experiments to the necessary sample sizes required for population-scale studies. Here, we show the utility of village models, demonstrating how cells can be assigned to an induced pluripotent stem line using single-cell sequencing and illustrating that the genetic, epigenetic or induced pluripotent stem line-specific effects explain a large percentage of gene expression variation for many genes. We demonstrate that village methods can effectively detect induced pluripotent stem line-specific effects, including sensitive dynamics of cell states.


Conflict of interest statement

The iPSC village model co-culture system (comprising of wet lab protocols and computational pipelines) is covered by a provisional patent application (2023901013) entitled ‘CELL CULTURES AND METHODS OF USE THEREOF’ has been submitted by the Garvan Institute of Medical Research (Inventors J.E.P). All other authors declare no other competing interests.

Figures

Fig. 1
Fig. 1. Experimental design and analytical approaches.
a The experimental design to test for the impact of village culture conditions on individual hiPSC lines using scRNA-seq. Phase I compares the impact of the village culture system using fresh samples collected at each site. Phase II investigates whether cryopreservation of village samples impacts individual hiPSC lines. Phase III utilizes all samples to investigate dynamic effects of the hiPSC lines across pseudotime. Each phase utilizes expression matrices that are separated by condition (site for phase I, cryopreservation status for phase II and pseudotime for phase III) as well as covariate matrices for each condition that contain the hiPSC line, replicate and village status. b A linear mixed model is used to estimate the variance of expression for each gene that is explained by each covariate. Those estimates are calculated for each condition in each Phase of the experimental design and used for downstream analyses. c The pseudotime is estimated for the cells from all samples and used in a linear mixed model to identify genetic effects that are dynamic across pseudotime. ×3: samples in triplicate; 10x Genomics: 10x Genomics scRNA-seq capture. All figure parts are representative.
Fig. 2
Fig. 2. Impact of village culturing system.
a Experimental design to test the impact of village culturing systems on hiPSC transcriptional profiles. The same experiment was carried out at each of the three different sites in triplicate. b The proportions of each of the three hiPSC lines at each of the three different sites from uni- and village cultures. Error bars show the standard error of the triplicates around the mean. c Histograms of the variance of gene expression that is explained by the covariates and the interaction of the covariates measured. The lines below the histogram each represent a gene for that covariate. d The variance of important stem cell markers explained by the covariates. e Important stem cell marker expression for each hiPSC line at each Site. Differential expression was calculated with logistic regression and significance was corrected for multiple comparisons. hiPSC: human induced pluripotent stem cell; *adjusted P-value < 0.05 for differential expression.
Fig. 3
Fig. 3. eQTL detection consistent in Uni-culture and Village samples.
a Replication of eQTLs previously described by DeBoever et al. Significance detected with a two-sided Chi squared test. b Two-sided Spearman rank correlation between the effect sizes of previously reported eQTLs in the Uni-culture (x-axis) and Village (y-axis) samples. c The previously reported eQTL for CHCHD2 demonstrates a strong and consistent effect across different Sites and the Village status. The gray band around the line indicates the standard error.
Fig. 4
Fig. 4. Dynamic variance explained across stem cell pseudotime.
a Pseudotime appeared to define cell pluripotency as evidenced by pluripotency markers and ectodermal markers expressed higher pseudotime corresponding to spontaneously differentiated cells. b The pseudotime projected onto the UMAP of all cells. ce Markers representative of pseudotime progression: pluripotency (POU5F1; c), Neural Ectoderm (LIX1, d) and Epidermal Ectoderm (PTN; e). f The dynamic interaction of pseudotime with the CHCHD2 gene—hiPSC line effects are larger at smaller pseudotime values (pluripotent cells) and smaller at larger pseudotime values (spontaneously differentiated cells). The band around the lines represents the standard error. hiPSC: human induced pluripotent stem cell.
Fig. 5
Fig. 5. Large hiPSC village differentiation and maintenance.
a Experimental design for testing a large village of 18 unrelated hiPSC lines including the cell numbers and transcriptional profiles during cardiomyocyte differentiation and hiPSC village maintenance. b Proportion of cells from each hiPSC line during cardiomyocyte differentiation (15-day protocol). c Proportion of cells from each hiPSC line during hiPSC village culture maintenance. d Proportion of gene expression variance during hiPSC village maintenance explained by the covariates measured in this dataset—Line and Passage. Each line in the rug plot below the histogram shows the observation of a gene for that covariate. e Replication of eQTLs previously described by DeBoever et al. with the 18-line iPSC village with 83% of eQTLs in concordant directions. Significance identified with two-sided Chi-squared test.

References

    1. Kilpinen H, et al. Common genetic variation drives molecular heterogeneity in human iPSCs. Nature. 2017;546:370–375. doi: 10.1038/nature22403. - DOI - PMC - PubMed
    1. Jerber J, et al. Population-scale single-cell RNA-seq profiling across dopaminergic neuron differentiation. Nat. Genet. 2021;53:304–312. doi: 10.1038/s41588-021-00801-6. - DOI - PMC - PubMed
    1. Neavin D, et al. Single cell eQTL analysis identifies cell type-specific genetic control of gene expression in fibroblasts and reprogrammed induced pluripotent stem cells. Genome Biol. 2021;22:76. doi: 10.1186/s13059-021-02293-3. - DOI - PMC - PubMed
    1. Daniszewski, M., Senabouth, A., Liang, H. H. & Han, X. Retinal ganglion cell-specific genetic regulation in primary open angle glaucoma. Cell Genomics2, 100142 (2022). - PMC - PubMed
    1. Takahashi K, Yamanaka S. Induction of pluripotent stem cells from mouse embryonic and adult fibroblast cultures by defined factors. Cell. 2006;126:663–676. doi: 10.1016/j.cell.2006.07.024. - DOI - PubMed

Publication types