. 2023 Jun 9;14(1):3417.
doi: 10.1038/s41467-023-38682-4.

Persistent serum protein signatures define an inflammatory subcategory of long COVID

Affiliations

Persistent serum protein signatures define an inflammatory subcategory of long COVID

Aarthi Talla et al. Nat Commun. .

Abstract

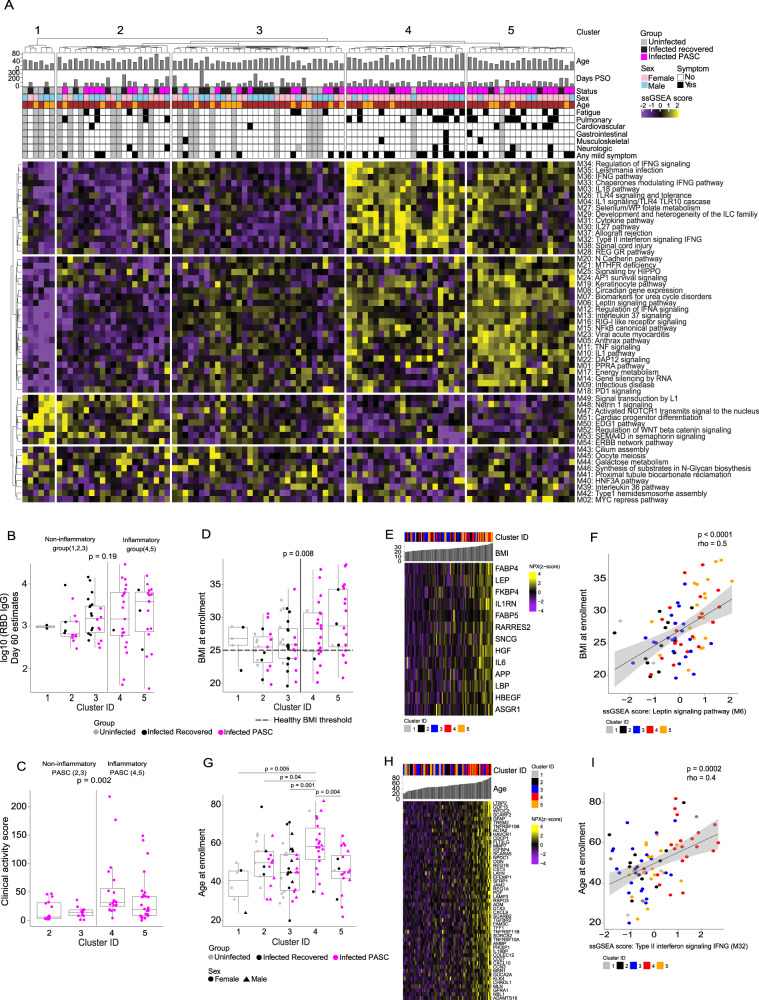
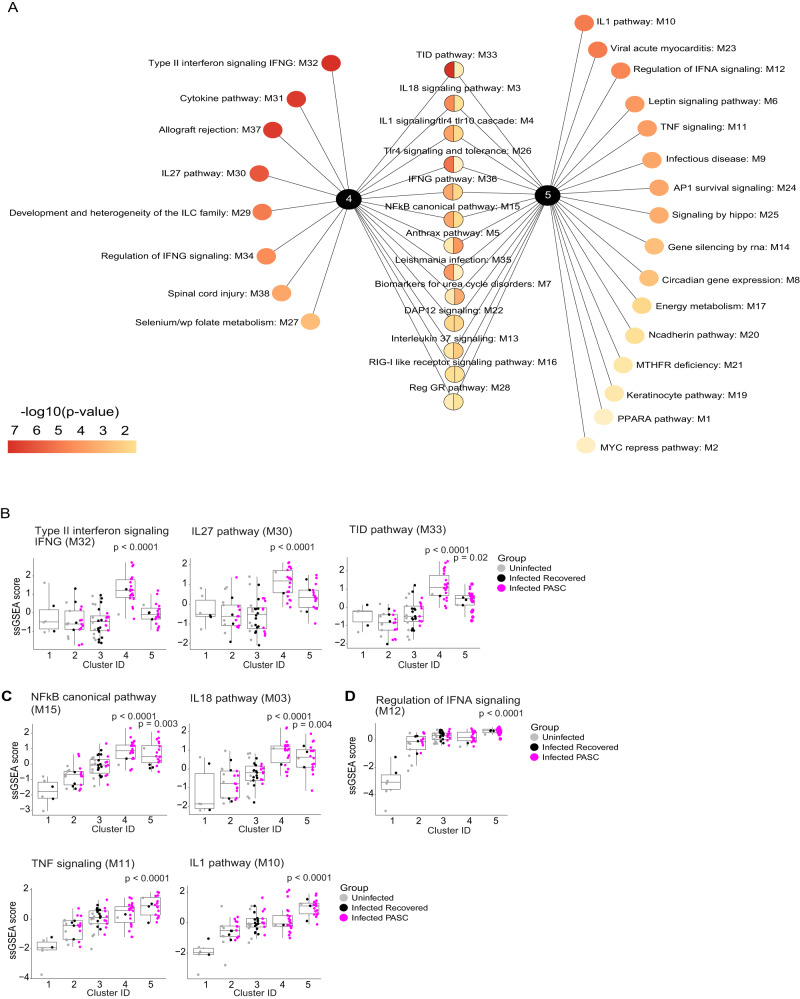
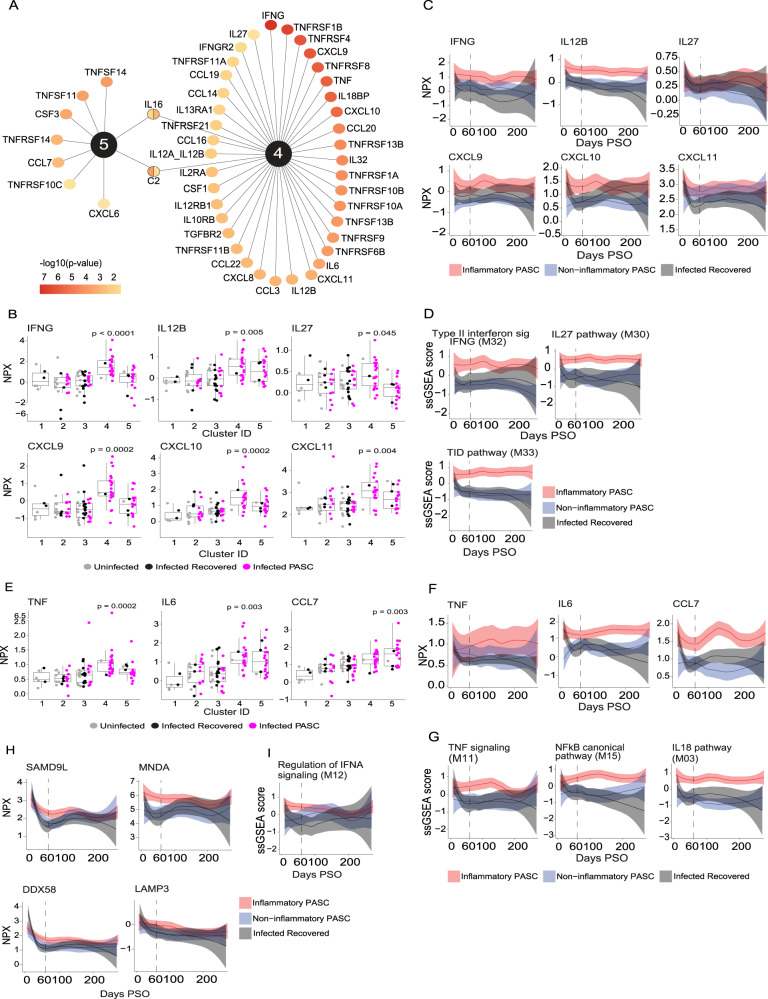
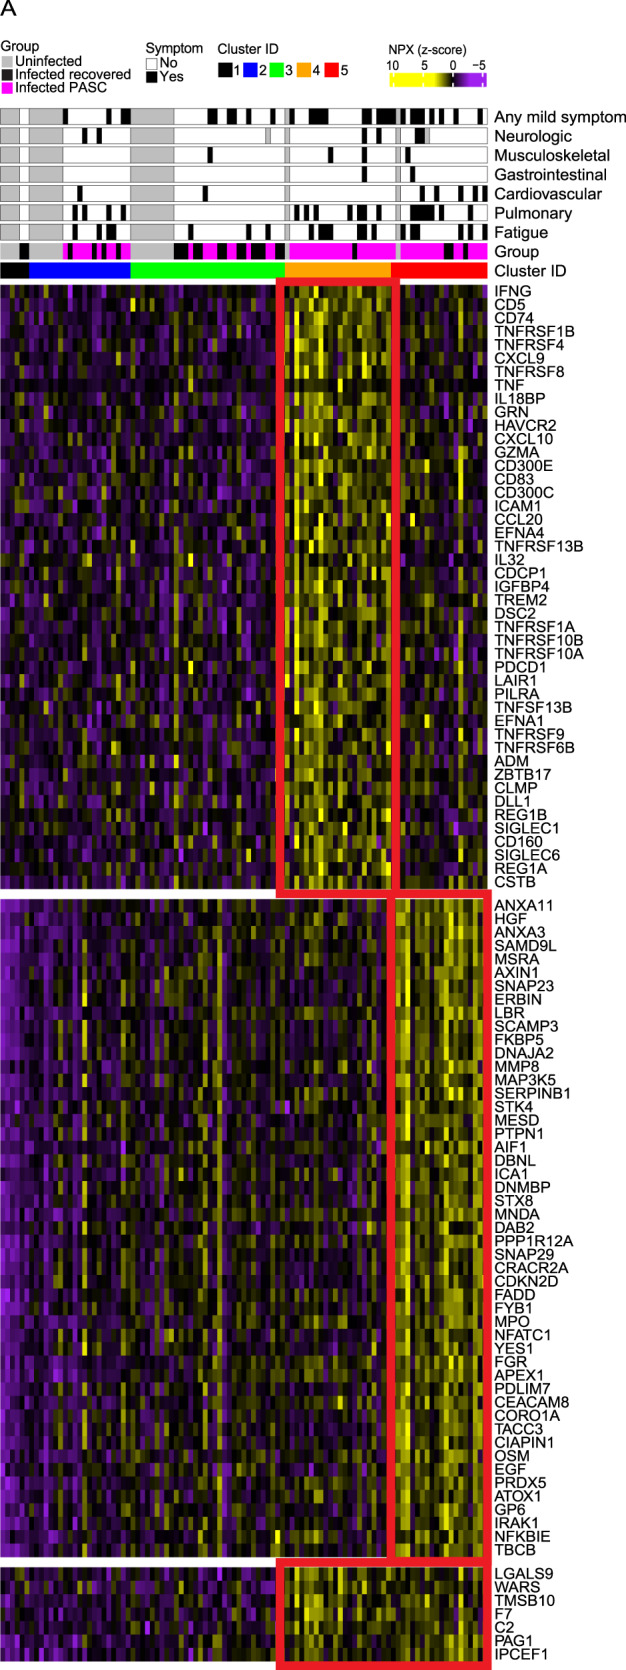
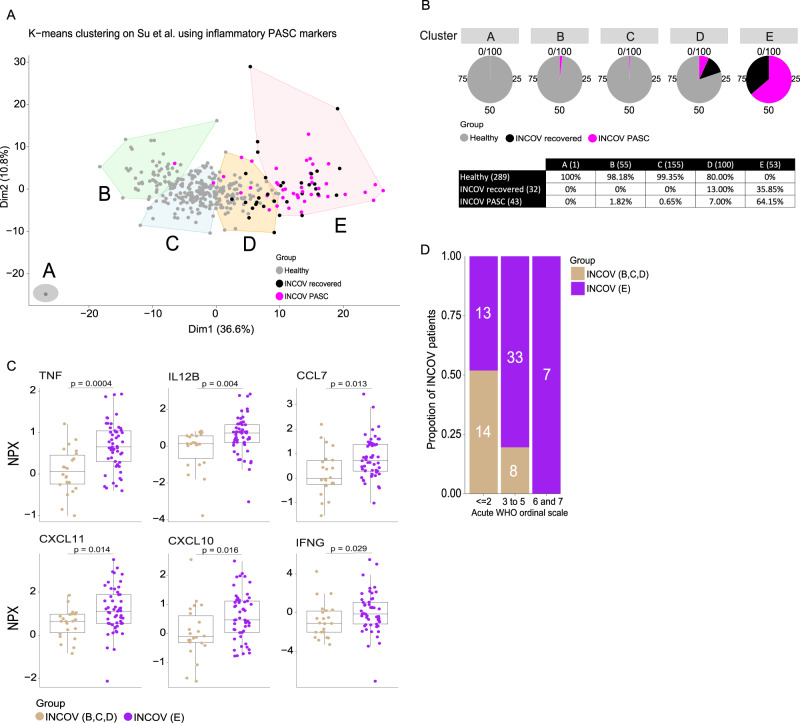
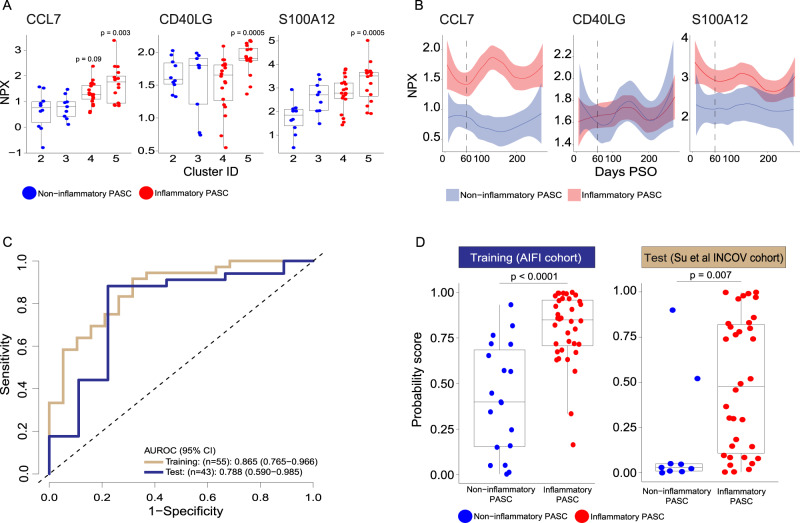
Long COVID or post-acute sequelae of SARS-CoV-2 (PASC) is a clinical syndrome featuring diverse symptoms that can persist for months following acute SARS-CoV-2 infection. The aetiologies may include persistent inflammation, unresolved tissue damage or delayed clearance of viral protein or RNA, but the biological differences they represent are not fully understood. Here we evaluate the serum proteome in samples, longitudinally collected from 55 PASC individuals with symptoms lasting ≥60 days after onset of acute infection, in comparison to samples from symptomatically recovered SARS-CoV-2 infected and uninfected individuals. Our analysis indicates heterogeneity in PASC and identified subsets with distinct signatures of persistent inflammation. Type II interferon signaling and canonical NF-κB signaling (particularly associated with TNF), appear to be the most differentially enriched signaling pathways, distinguishing a group of patients characterized also by a persistent neutrophil activation signature. These findings help to clarify biological diversity within PASC, identify participants with molecular evidence of persistent inflammation, and highlight dominant pathways that may have diagnostic or therapeutic relevance, including a protein panel that we propose as having diagnostic utility for differentiating inflammatory and non-inflammatory PASC.


Conflict of interest statement

A.T., S.V.V., G.L.S., T.R.T., P.J.S., X.L., and T.F.B. have a provisional patent on protein signatures in Long COVID (Application PCT/US2022/026841). The remaining authors declare no competing interests.

Figures

Fig. 1
Fig. 1. Serum proteomic clustering and clinical metadata of PASC.
A Single Sample Gene Set Enrichment Analysis (ssGSEA) score heatmap of the rule-in selected serum proteome modules (rows), across 55 PASC, 24 recovered and 22 uninfected participants (columns). B Receptor binding domain (RBD)-specific IgG titers (y-axis) in 55 PASC and 24 recovered participants between clusters. The p-value was calculated comparing, as a group, inflammatory versus non-inflammatory clusters using a two-sided Wilcoxon test. C Clinical activity score (y-axis) of acute COVID symptoms in 55 PASC participants from inflammatory (4 & 5) vs. non-inflammatory (2 & 3) clusters. The p-value was calculated by comparing inflammatory PASC versus non-inflammatory PASC using a two-sided Wilcoxon test. D Body Mass Index (BMI) at enrollment (y-axis) across clusters (x-axis) in 55 PASC, 24 recovered and 22 uninfected. Healthy BMI cutoff is indicated by the dashed line. The p-value was calculated by comparing inflammatory clusters (4,5) to the other clusters using a two-sided Wilcoxon test. E Heatmap of proteins (rows) significantly (p-value < 0.05) correlated with BMI across all COVID-19+ participants (columns). The p-values were determined by a two-sided Spearman’s correlation test. F Correlation between the ssGSEA score of the leptin signaling module (x-axis) and BMI at enrollment (y-axis) across all COVID-19+ participants. The p-value was determined by a two-sided Spearman’s correlation test. G The age at enrollment (y-axis) across clusters (x-axis), in 55 PASC, 24 recovered and 22 uninfected. P-values were determined by a two-sided Wilcoxon test by pairwise cluster comparison. Box plots show the median (centerline), the first and third quartiles (the lower and upper bound of the box) and the whiskers show the 1.5x interquartile range of the data. H Heatmap of the proteins (as rows) significantly (p-value < 0.05) correlated with age across all COVID-19+ participants (as columns). The p-values were determined by a two-sided Spearman’s correlation test. i Correlation between the ssGSEA score of the type II interferon signaling module (x-axis) and age at enrollment (y-axis) across all COVID-19+ participants. The p-value was determined by a two-sided Spearman’s correlation test. The bands in all correlation scatter plots display the 95% confidence interval.
Fig. 2
Fig. 2. Key pathway modules driving inflammatory PASC signatures.
A Modules that are significantly expressed more highly in clusters 4 and 5 relative to all other clusters. Modules unique to a cluster are arranged and ranked by increasing adjusted p-value of <0.05, while modules expressed in both clusters are arranged and ranked by the average of their adjusted p-values. The color gradient of each node represents the -log10 adjusted p-value. P-values were determined by a two-sided Wilcoxon test. BD Box and jitter plots of the Single Sample Gene Set Enrichment Analysis (ssGSEA) scores (y-axis) across all clusters (x-axis) (that consist of PASC, n = 55; recovered, n = 24; uninfected, n = 22 participants) for the top-ranked modules that were enriched in inflammatory clusters 4 and 5. P-values determined by a two-sided Wilcoxon test were calculated comparing inflammatory cluster 4 and inflammatory cluster 5 independently to clusters 1,2,3. Box plots show the median (centerline), the first and third quartiles (the lower and upper bound of the box) and the whiskers show the 1.5x interquartile range of the data.
Fig. 3
Fig. 3. Longitudinal assessment of key cytokines and chemokines driving inflammatory PASC signatures.
A Differentially expressed cytokines, chemokines, and their receptors up-regulated in inflammatory clusters 4 & 5. Proteins significantly up-regulated in clusters 4 and 5 relative to all other clusters are reported. P-values were tested by a two-sided Wilcoxon test and adjusted for multiple comparisons. The color gradient of nodes represents the -log10 adjusted p-value. B Box plots of IFN-γ Normalized Protein Expression (NPX) (y-axis) and its related cytokines and chemokines across clusters (x-axis) in 55 PASC, 24 recovered, 22 uninfected participants which were significantly upregulated exclusively in cluster 4. P-values were calculated comparing inflammatory clusters 4 and 5 independently to clusters 1,2,3, using a two-sided Wilcoxon test. C Longitudinal Loess fit plots of IFN-γ NPX (y-axis) and its related cytokines and chemokines on samples available from early acute infection through >250 days post symptom onset (PSO) (x-axis). PASC participants from inflammatory clusters 4 and 5 are represented as inflammatory PASC (red), PASC participants from clusters 2 and 3 as non-inflammatory PASC (blue) while the recovered participants are in black. D Longitudinal Loess fit plots of the Single Sample Gene Set Enrichment Analysis (ssGSEA) scores (y-axis) of IFN-γ related modules over time (x-axis). E Box plots of TNF, IL6 and CCL7 NPX (y-axis) across clusters (x-axis) in 55 PASC, 24 recovered, 22 uninfected participants which were significantly upregulated in clusters 4 and 5. P-values were calculated comparing clusters 4 and 5 independently to clusters 1,2,3, using a two-sided Wilcoxon test. All box plots show the median (centerline), the first and third quartiles (the lower and upper bound of the box) and the whiskers show the 1.5x interquartile range of the data. F Longitudinal Loess fit plots of TNF, IL6 and CCL7 NPX (y-axis) over time (x-axis). G Longitudinal Loess fit plots of the ssGSEA scores (y-axis) of TNF and NF-κB related signaling modules over time (x-axis). H, I Longitudinal Loess fit plots of NPX and ssGSEA scores (y-axes) of type-I IFN-driven proteins and the IFN-α module over time (x-axis) respectively. The bands in all loess smooth fit plots display the 95% confidence interval.
Fig. 4
Fig. 4. Top 50 overall serum proteins driving the signatures observed in the two inflammatory PASC clusters.
A Heatmap of the top 50 Olink serum proteins ranked by adjusted p-value < 0.05 that are up-regulated in inflammatory clusters 4 and 5 compared to all other clusters. Rows represent individual proteins; columns represent individual samples and the scaled Normalized Protein Expression (NPX) expression across samples is depicted from low (purple) to high (yellow). The p-value determined by a two-sided Wilcoxon test was calculated comparing one cluster of participants to all other groups.
Fig. 5
Fig. 5. Independent cohort validation of inflammatory PASC signatures.
A K-means unsupervised clustering of Olink proteomic data from Su Y et al. (2022) showing 5 clusters, AE of INCOV participants that consisted of PASC (symptomatic) and recovered (participants showing no PASC symptoms) along with healthy controls. B Pie chart representation and table showing the percentage of PASC, recovered and healthy participants within each cluster. The number of participants per cluster (columns) and per group (rows) are represented within brackets. C Box and jitter plots of cytokines/chemokines significantly upregulated in the INCOV participants of cluster E (n = 53) vs. INCOV participants of clusters B, C, and D (n = 22). P-values were determined by a two-sided Wilcoxon test. Box plots show the median (centerline), the first and third quartiles (the lower and upper bound of the box) and the whiskers show the 1.5x interquartile range of the data. D Distribution of different disease severities, as judged by World Health Organization (WHO) ordinal scale across INCOV participants in cluster E vs INCOV participants in clusters B, C, and D. Y-axis and the numbers in bar graphs represent proportion and number of participants per INCOV group in each WHO scale bin respectively.
Fig. 6
Fig. 6. Diagnostic panel for inflammatory vs non-inflammatory PASC.
A Box and jitter plots of CCL7, CD40LG and S100A12 Normalized Protein Expression (NPX) (y-axis) between PASC in inflammatory clusters 4 and 5 (n = 36) and PASC in non-inflammatory clusters 2,3 and 4 (n = 19) (x-axis). P-values determined by a two-sided Wilcoxon test were calculated comparing inflammatory cluster 4 and inflammatory cluster 5 independently to clusters 2 and 3. B Longitudinal Loess fit plots of CCL7, CD40LG and S100A12 NPX on samples available from early acute infection through >250 days post symptom onset (PSO) (x-axis). PASC participants from inflammatory clusters 4 and 5 are represented here as inflammatory PASC (red), PASC participants from clusters 2 and 3 are represented here as non-inflammatory PASC (blue). The bands in the loess smooth fit plots display the 95% confidence interval. C Receiver operating characteristic (ROC) curves of a logistic regression (LogReg) model of three proteins (CCL7, CD40L, S100A12) for distinguishing inflammatory versus non-inflammatory PASC and the corresponding areas under the ROC curve (AUROCs) on the training data (n = 36 inflammatory and n = 19 non-inflammatory) and the test data (INCOV: n = 34 inflammatory and n = 9 non-inflammatory). D Boxplots of the LogReg probability scores distinguishing inflammatory (n = 36) versus non-inflammatory (n = 19) PASC, left panel in the training dataset and inflammatory (n = 34) versus non-inflammatory (n = 9) INCOV test data, right panel. P-values were determined by a two-sided Wilcoxon test. All box plots show the median (centerline), the first and third quartiles (the lower and upper bound of the box) and the whiskers show the 1.5x interquartile range of the data.

References

    1. Groff D, et al. Short-term and Long-term Rates of Postacute Sequelae of SARS-CoV-2 Infection: A Systematic Review. JAMA Netw. Open. 2021;4:e2128568. doi: 10.1001/jamanetworkopen.2021.28568. - DOI - PMC - PubMed
    1. Nalbandian A, et al. Post-acute COVID-19 syndrome. Nat. Med. 2021;27:601–615. doi: 10.1038/s41591-021-01283-z. - DOI - PMC - PubMed
    1. Wang L, et al. PASCLex: A comprehensive post-acute sequelae of COVID-19 (PASC) symptom lexicon derived from electronic health record clinical notes. J. Biomed. Inform. 2022;125:103951. doi: 10.1016/j.jbi.2021.103951. - DOI - PMC - PubMed
    1. Chevinsky JR, et al. Late Conditions Diagnosed 1-4 Months Following an Initial Coronavirus Disease 2019 (COVID-19) Encounter: A Matched-Cohort Study Using Inpatient and Outpatient Administrative Data-United States, 1 March-30 June 2020. Clin. Infect. Dis. 2021;73:S5–S16. doi: 10.1093/cid/ciab338. - DOI - PMC - PubMed
    1. Bell ML, et al. Post-acute sequelae of COVID-19 in a non-hospitalized cohort: Results from the Arizona CoVHORT. PLoS One. 2021;16:e0254347. doi: 10.1371/journal.pone.0254347. - DOI - PMC - PubMed

Publication types