. 2023 Jun 9;14(1):3412.
doi: 10.1038/s41467-023-38567-6.

Genomics of cold adaptations in the Antarctic notothenioid fish radiation

Affiliations

Genomics of cold adaptations in the Antarctic notothenioid fish radiation

Iliana Bista et al. Nat Commun. .

Abstract

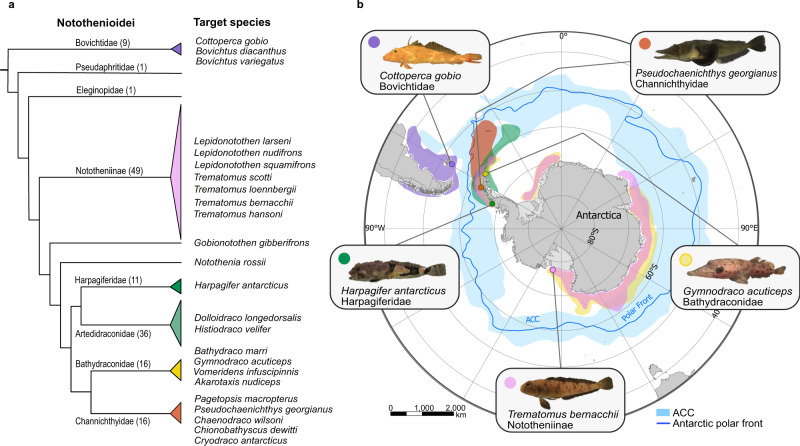
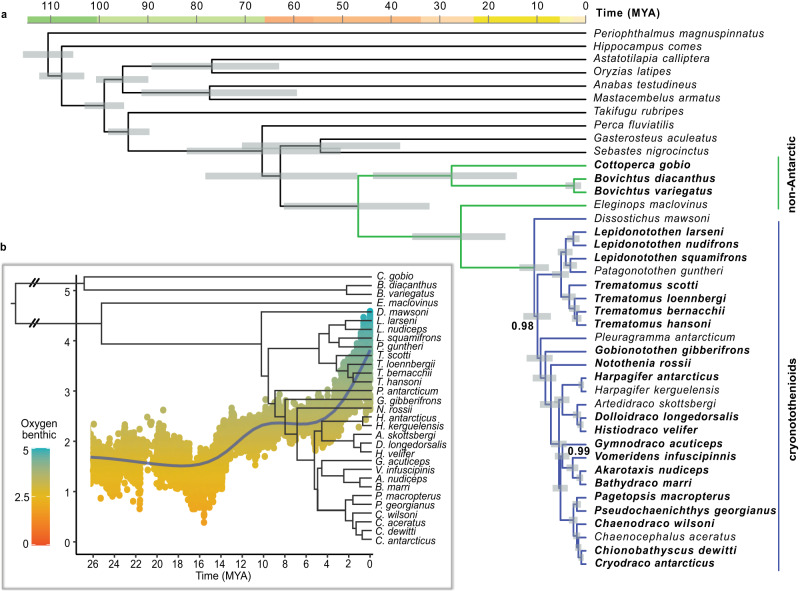
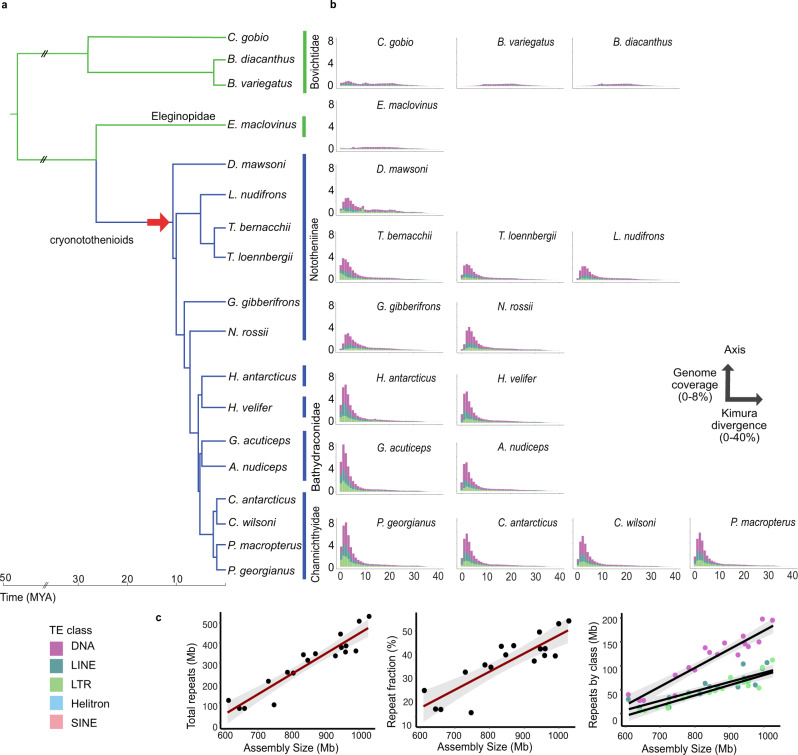
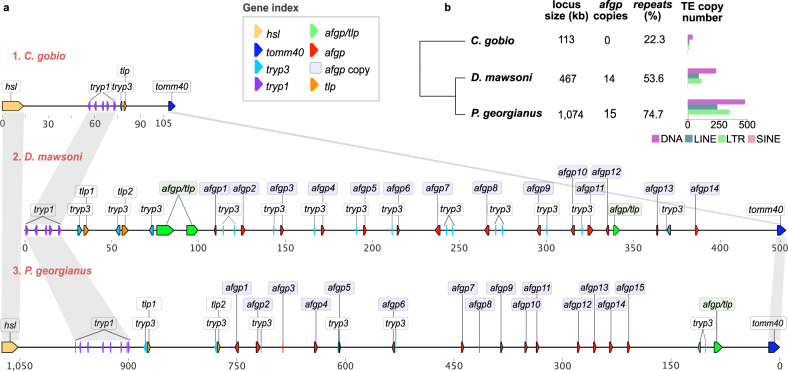
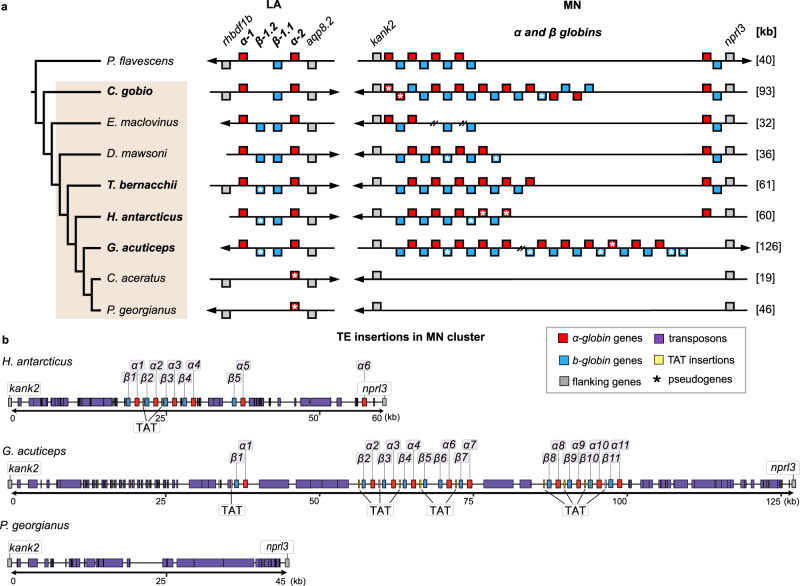
Numerous novel adaptations characterise the radiation of notothenioids, the dominant fish group in the freezing seas of the Southern Ocean. To improve understanding of the evolution of this iconic fish group, here we generate and analyse new genome assemblies for 24 species covering all major subgroups of the radiation, including five long-read assemblies. We present a new estimate for the onset of the radiation at 10.7 million years ago, based on a time-calibrated phylogeny derived from genome-wide sequence data. We identify a two-fold variation in genome size, driven by expansion of multiple transposable element families, and use the long-read data to reconstruct two evolutionarily important, highly repetitive gene family loci. First, we present the most complete reconstruction to date of the antifreeze glycoprotein gene family, whose emergence enabled survival in sub-zero temperatures, showing the expansion of the antifreeze gene locus from the ancestral to the derived state. Second, we trace the loss of haemoglobin genes in icefishes, the only vertebrates lacking functional haemoglobins, through complete reconstruction of the two haemoglobin gene clusters across notothenioid families. Both the haemoglobin and antifreeze genomic loci are characterised by multiple transposon expansions that may have driven the evolutionary history of these genes.


Conflict of interest statement

The authors declare no competing interests.

Figures

Fig. 1
Fig. 1. The Notothenioidei suborder, all 24 target species, and representative geographic distributions of PacBio sequenced species.
a Notothenioid families and a number of species contained in each family based on the species list by ref. are shown in parentheses, except for the Nototheniidae, which are paraphyletic, containing the Nototheniinae, G. gibberifrons and N. rossi. The target species sequenced in the present study are listed next to the tree. b Map of Antarctica and the Southern Ocean showing the geographic distribution of the five notothenioid species sequenced with PacBio. Colours correspond to the respective families on the tree. Coloured circles on the map indicate the sampling location. The blue belt around Antarctica indicates the region of the Antarctic Circumpolar Current (ACC), and the thin blue line the Antarctic polar front. The map was generated using ArcGIS (GIS Software, Version 10.0). Data for the geographic distribution of each species were derived from the Scientific Committee for Antarctic Research (SCAR), Antarctic Biodiversity Portal (https://www.biodiversity.aq/), comprising occurrence records from multiple databases. Source data are provided as a Source Data file.
Fig. 2
Fig. 2. New time-calibrated phylogeny and paleoclimate analysis.
a Time-calibrated phylogeny of 41 percomorph fish species, including 31 species of notothenioids and 10 outgroup fish species, generated with BEAST2. Branch length corresponds to time in million years (MYA) and grey rectangles show 95% highest posterior density intervals for node age estimates. All nodes received full support (Bayesian posterior probability = 1) except where noted. Species in bold were sequenced in this study. Branches for the Antarctic clade are highlighted in blue (cryonotothenioids), and non-Antarctic notothenioid species are marked in green. b Diversification of notothenioid species and temperature variation through time. Tree based on notothenioid species from panel a. The scatterplot shows data based on deep-sea δ18O benthic records which inversely reflect temperature with higher δ18O benthic corresponding to lower temperatures (green) and lower δ18O corresponding to higher temperatures (orange). The oxygen benthic is expressed as a ratio of two concentrations of oxygen isotopes; blue line shows moving average (Generalised Additive Model). Source data can be found in the Dryad repository at 10.5061/dryad.80gb5mktn.
Fig. 3
Fig. 3. Expansion of transposable elements and genome size variation in notothenioid genomes.
a Species analysed, including 16 species sequenced in this study, and two previously published genomes (E. maclovinus, and D. mawsoni). b Repeat landscape plots showing the distribution of transposable element copies as percentage of divergence from consensus repeat models (x-axis, Kimura divergence) versus genome coverage (y-axis). Colours represent different TE classes. The red arrow indicates the timing of the earliest TE expansion identified in our analysis. c Correlation of repeat content with genome size (Pearson Correlation Coefficient, n = 16, R = 0.95, two-sided p = 1.647e-08, slope = 0.99), an increase of repeat fraction with genome size, and increase of DNA, LINE, and LTR TE classes with genome size. The shaded zone indicates 95% confidence interval. The plot was generated using package ggplot2 and function ggpubr. Double forward slashes in the time axis indicate a cropped line in the tree branches. Source data are provided as a Source Data file.
Fig. 4
Fig. 4. Reconstruction of the antifreeze locus.
a Reconstructed physical map of the antifreeze locus for three notothenioid species: (1) C. gobio, which represents the ancestral state of the locus, (2) D. mawsoni, and (3) P. georgianus, which represent derived loci. The C. gobio and D. mawsoni loci are shown at the same scale, and the P. georgianus locus is shown in half scale and reverse orientation. Coloured triangles represent different genes and lilac rectangles represent afgp copies (see gene index). afgp: antifreeze glycoprotein genes, tlp: trypsinogen-like protease, tryp1: trypsinogen1, tryp3: trypsinogen3 (both tryp1 and tryp3 are prss59 homologues), tomm40: translocase of outer mitochondrial membrane 40 homolog, hsl: hormone sensitive lipase (lipeb), afgp/tlp: chimeric afgp and tlp gene. b Cladogram of the three species analysed, with total length of locus, repeat content (%), number of afgp gene copies, and number of transposon copies annotated in each species locus (including DNA, LINE, LTRs, and SINE elements). Colours represent different TE classes as shown in legend. Source data are provided as a Source Data file.
Fig. 5
Fig. 5. Reconstructed synteny of haemoglobin loci and TE insertions.
a Species analysed and syntenic reconstruction of LA and MN haemoglobin gene clusters. b Transposon insertions in the MN region of H. antarcticus, G. acuticeps, and P. georgianus genomes. Red: α-globin genes, blue: β-globin genes, grey: flanking genes, purple: transposon insertions, yellow: TAT-like repeats. Pseudogenes are marked with asterisks. Breaks in the assembly are indicated with double forward slashes. Bold face indicates species sequenced in the present study. Arrows show locus orientation and total lengths of MN locus in different species are given in brackets (kb, at right). Source data are provided as a Source Data file.

References

    1. Eastman JT. The nature of the diversity of Antarctic fishes. Polar Biol. 2005;28:93–107. doi: 10.1007/s00300-004-0667-4. - DOI
    1. Parker E, Dornburg A, Struthers CD, Jones CD, Near TJ. Phylogenomic species delimitation dramatically reduces species diversity in an Antarctic adaptive radiation. Syst. Biol. 2021;71:58–77. doi: 10.1093/sysbio/syab057. - DOI - PubMed
    1. Eastman JT, Eakin RR. Checklist of the species of notothenioid fishes. Antarct. Sci. 2021;33:1–8. doi: 10.1017/S0954102020000632. - DOI
    1. Beers JM, Jayasundara N. Antarctic notothenioid fish: what are the future consequences of “losses” and “gains” acquired during long-term evolution at cold and stable temperatures? J. Exp. Biol. 2015;218:1834–1845. doi: 10.1242/jeb.116129. - DOI - PubMed
    1. Clarke A, Crame JA. The Southern Ocean benthic fauna and climate change: a historical perspective. Philos. Trans. R. Soc. Lond. B. 1992;338:299–309. doi: 10.1098/rstb.1992.0150. - DOI

Publication types

LinkOut - more resources