. 2023 Jun 9;14(1):3357.
doi: 10.1038/s41467-023-38887-7.

Histone H2A Lys130 acetylation epigenetically regulates androgen production in prostate cancer

Affiliations

Histone H2A Lys130 acetylation epigenetically regulates androgen production in prostate cancer

Thanh Nguyen et al. Nat Commun. .

Erratum in

Abstract

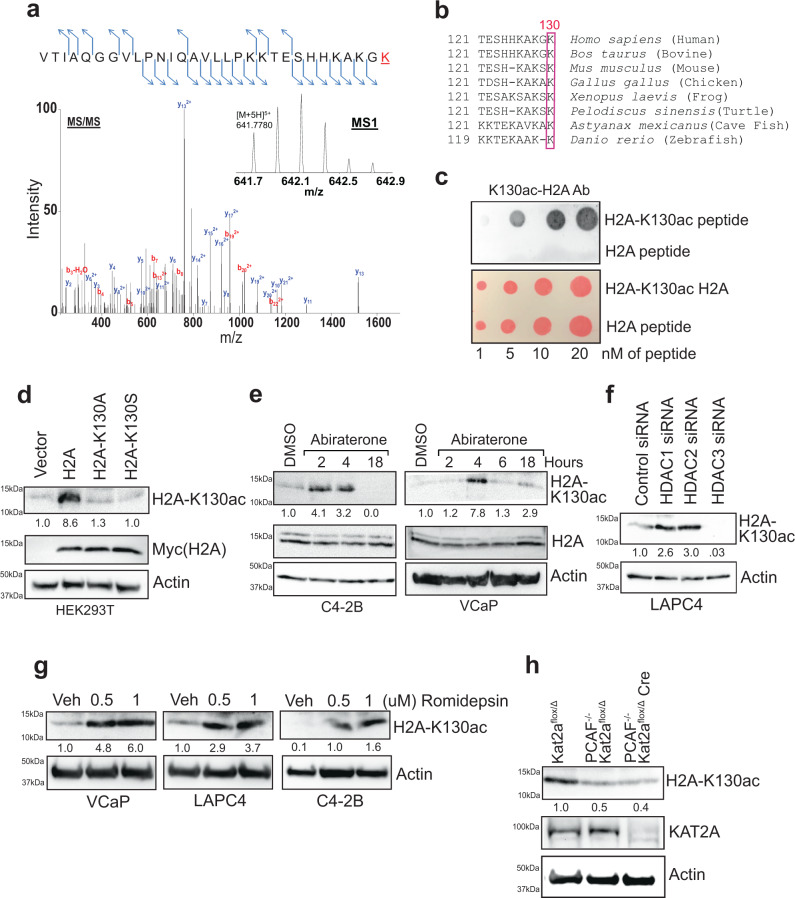
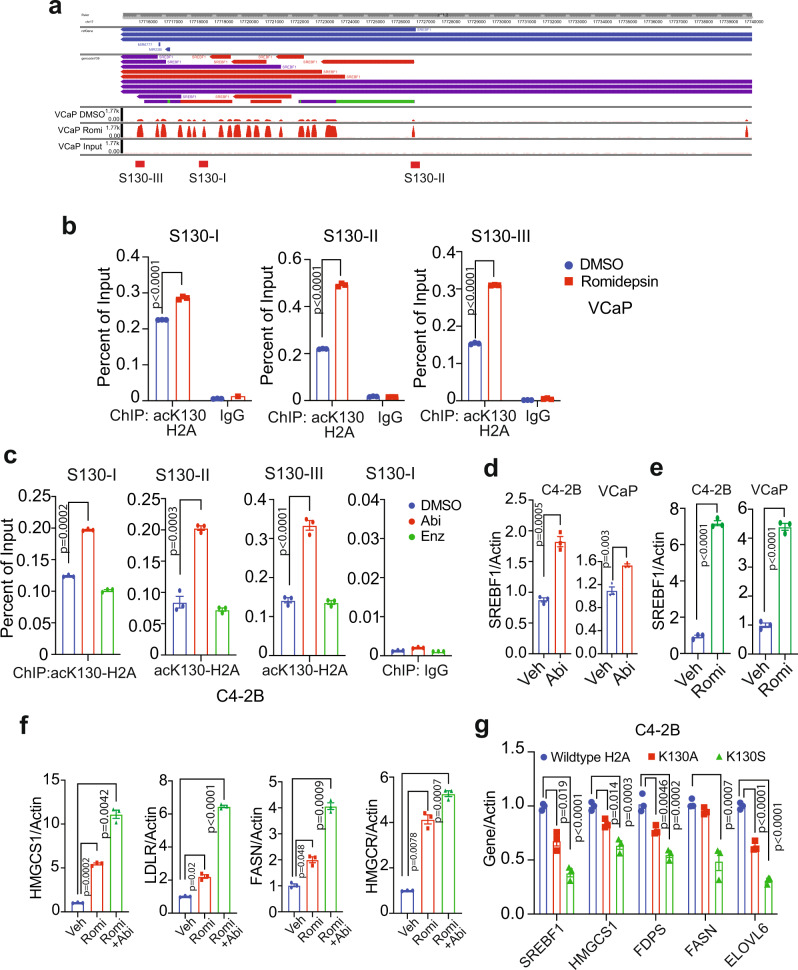
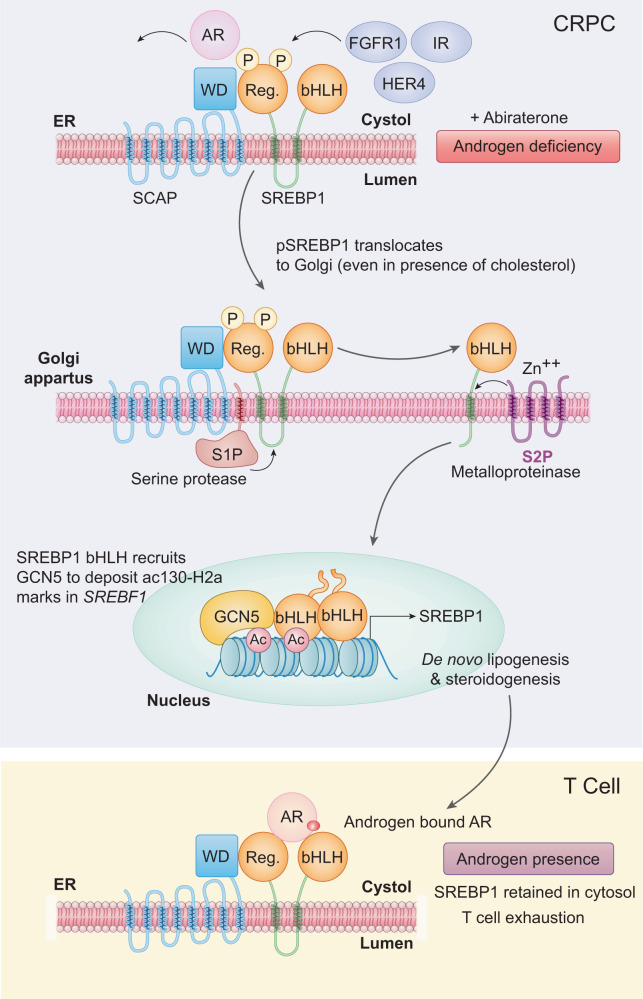
The testicular androgen biosynthesis is well understood, however, how cancer cells gauge dwindling androgen to dexterously initiate its de novo synthesis remained elusive. We uncover dual-phosphorylated form of sterol regulatory element-binding protein 1 (SREBF1), pY673/951-SREBF1 that acts as an androgen sensor, and dissociates from androgen receptor (AR) in androgen deficient environment, followed by nuclear translocation. SREBF1 recruits KAT2A/GCN5 to deposit epigenetic marks, histone H2A Lys130-acetylation (H2A-K130ac) in SREBF1, reigniting de novo lipogenesis & steroidogenesis. Androgen prevents SREBF1 nuclear translocation, promoting T cell exhaustion. Nuclear SREBF1 and H2A-K130ac levels are significantly increased and directly correlated with late-stage prostate cancer, reversal of which sensitizes castration-resistant prostate cancer (CRPC) to androgen synthesis inhibitor, Abiraterone. Further, we identify a distinct CRPC lipid signature resembling lipid profile of prostate cancer in African American (AA) men. Overall, pY-SREBF1/H2A-K130ac signaling explains cancer sex bias and reveal synchronous inhibition of KAT2A and Tyr-kinases as an effective therapeutic strategy.


Conflict of interest statement

A patent “Inhibitors of ACK1/TNK2 Tyrosine Kinase” (patent no. 9,850,216; 10,017,478 and 10,336,734) covers (R)-9b compound. NPM and KM are named as inventors. These patents have been licensed by TechnoGenesys Inc. KM and NPM are co-founders of TechnoGenesys Inc., own stocks, and serve as consultants for TechnoGenesys Inc. The other authors declare no potential conflicts of interest..

Figures

Fig. 1
Fig. 1. CRPCs enrich epigenetic marks, H2A-K130ac upon androgen deprivation.
a Histones purified from abiraterone-treated C4-2B cells were subjected to mass spectrometry-based identification. The intact peptide (MS1) was detected with m/z of 641.7780(5+), which represents a ppm error of 0.70. The MS/MS spectrum was matched to the peptide with Lys130 acetylated VTIAQGGVLPNIQAVLLPKKTESHHKAKGK. The identification was made by both Sequest and Mascot with Xcorr 6.57, delta CN 0.03, and Mascot ion score of 36. b Evolutionary conservation of Lys130 in histone H2A. c Acetylated histone H2A peptide and corresponding non-acetylated peptides were immunoblotted (IB) with H2A-K130ac antibody. Lower blot is Ponceau S stained. d HEK293 cells were transfected with constructs expressing Myc-tagged H2A or its mutants, K130A and K130S. Lysates were immunoprecipitated (IP) with H2A-K130ac antibody, followed by immunoblotting (IB) with Myc antibody (top panel). Lysates were also subjected to IB with Myc and Actin antibodies (lower panels). e C4-2B and VCaP cells were treated with abiraterone acetate (7.5 µM) in -FBS media for 2, 4, or 18 h. Lysates were IP with H2A-K130ac antibody, followed by IB with H2A antibody (top panel). f LAPC4 cells were transfected with siRNAs for HDAC1, 2 and 3 and the lysates were IP with H2A-K130ac antibody, followed by IB with H2A antibody (top panel). g VCaP, LAPC4, and C4-2B cells were treated with vehicle or Romidepsin (0.5 & 1 µM), overnight and the lysates were IP with H2A-K130ac antibody, followed by IB with H2A antibody. h MEFs were stimulated with insulin for 30 min and lysates were IP with H2A-K130ac antibody, followed by IB with H2A antibody (top panel). Representative images are as shown (n = 3 biologically independent experiments). Source data are provided as a Source Data file.
Fig. 2
Fig. 2. Deposition of H2A-K130ac epigenetic marks in the exons of SREBF1 gene augments its expression.
a Romidepsin (0.5 µM, 18 h) treated VCaP cells were cross-linked, chromatin was isolated, and ChIP was performed using H2A-K130ac antibody or IgG, followed by sequencing. The peaks in the exons of SREBF1 gene and primers’ locations, designated as S130-I/II/III are shown in graphical format. b ChIP was performed as described above using H2A-K130ac antibody or IgG, followed by qPCR using primers corresponding to S130-I/II/III. c Abiraterone (Abi) or Enzalutamide or Enz (7.5 µM, 18 h) treated C4-2B cells were cross-linked and ChIP was performed using H2A-K130ac antibody, followed by qPCR using primers corresponding to S130-I/II/III. d RNA isolated from C4-2B and VCaP cells treated with vehicle or abiraterone (7.5 µM, 18 h) and was subjected to qRT-PCR with SREBF1 and actin primers. e RNA isolated from C4-2B and VCaP cells treated with vehicle or Romidepsin (0.5 µM, 18 h) and was subjected to qRT-PCR with SREBF1 and actin primers. f RNA isolated from C4-2B cells treated with vehicle, Romidepsin (0.5 µM, 18 h) or Romidepsin & abiraterone (0.5 µM and 7.5 µM) and qRT-PCR was done with indicated primers. g RNA isolated from C4-2B cells transfected with constructs expressing wildtype H2A or mutants K130A-H2A, K130S-H2A and was subjected to qRT-PCR with indicated primers. For (bg) The experiments were performed in triplicates (n = 3), and the experiments were repeated thrice independently with similar results; a representative dataset is shown. Data are represented as mean ± SEM. For (be), p values were determined by unpaired two-tailed Student’s t test. For (f, g), p values were determined by one-way ANOVA. Source data are provided as a Source Data file.
Fig. 3
Fig. 3. Phosphorylation of SREBF1 at Y673 and Y951 promotes its nuclear translocation in androgen deficient environment.
a Representation of SREBF1 expressing construct with N-terminal HA-tag, C-terminal Myc/His tags, and Tyr-phosphoryaltion sites. S1P & S2P are proteolytic cleavage sites and TM represents transmembrane domains. b VCaP, LAPC4, and C4-2B cells were treated with abiraterone (3 µM) for 4 h and fractionation was performed, followed by immunoblotting of nuclear and cytosolic fractions with indicated antibodies. c HEK293T cells were transfected with SREBF1 or Y673/951A double mutant, followed by abiraterone treatment (3 µM) for 4 h. Fractionation was performed, followed by immunoblotting of nuclear and cytosolic fractions with indicated antibodies. d, e C4-2B and LAPC4 cells were treated with abiraterone (3 µM) in -FBS media for indicated time. Lysates were immunoprecipitated with SREBF1, followed by immunoblotting with pTyr antibody. fh HEK293T cells were co-transfected with FGFR, HER4 or IR and HA-tagged SREBF1 or Y673/951A double-mutant. Lysates were immunoprecipitated with pTyr antibody on beads, followed by immunoblotting with anti-HA antibody (top panel). Representative images are as shown (n = 3 biologically independent experiments). Source data are provided as a Source Data file.
Fig. 4
Fig. 4. nSREBF1 recruits KAT2A to mark SREBF1 locus and promotes its transcription.
a C4-2B cells were infected with SREBF1 and Y673/951A double mutant expressing constructs, followed by abiraterone treatment (7.5 µM) for 4 h. The lysates were fractionated into trans and cis Golgi fractions and were immunoprecipitated with SREBF1 antibody, followed by immunoblotting with Myc or HA antibody. b HEK293T cells were transfected with SREBF1 and Y673/951A double mutant, followed by abiraterone treatment (7.5 µM) for 4 h. The lysates were immunoprecipitated with H2A-K130ac antibody, followed by immunoblotting with H2A antibody. c C4-2B cells were transfected with HA-tagged SREBF1 or Y673/951A double-mutant, followed by abiraterone treatment (7.5 µM) for 4 h. Lysates were immunoprecipitated with H2A-K130ac antibody, followed by immunoblotting with H2A antibody. d C4-2B cells were infected with SREBF1 or Y673/951A double mutant expressing constructs. Cells were treated with abiraterone (7.5 µM) for 4 h, followed by ChIP with HA (or IgG) antibodies. PCR was performed using S130-II primers. e RNA isolated from C4-2B cells infected with SREBF1 or Y673/951A double mutant expressing constructs and subjected to qRT-PCR with indicated primers. f C4-2B and LAPC4 cells were treated with abiraterone (7.5 µM) and lysates were immunoprecipitated with SREBF1, followed by immunoblotting with KAT2A antibody. g C4-2B cells were infected with HA-tagged SREBF1 or Y673/951A double-mutant expressing constructs. Lysates were immunoprecipitated with anti-HA affinity gel followed by immunoblotting with KAT2A antibody. h C4-2B cells were infected with SREBF1 or Y673/951A double mutant expressing constructs. Cells were treated with abiraterone (7.5 µM) for 4 h, followed by ChIP with KAT2A (or IgG) antibodies. PCR was performed using S130-1/II/III primers. For (d, e, h) (n = 3), the experiments were repeated thrice independently with similar results, and a representative dataset is shown. Data are represented as mean ± SEM. For (d), p values were determined by one-way ANOVA. For (e, h), p values were determined by paired and unpaired two-tailed Student’s t test, respectively. Source data are provided as a Source Data file.
Fig. 5
Fig. 5. Phosphorylation-deficient SREBF1 expressing tumors are sensitive to abiraterone treatment and CPTH2+Afatinib combination therapy overcomes abiraterone resistance.
a C4-2B cells were infected with the retroviral constructs encoding SREBF1 or Y673/951A double-mutant constructs. Cells were treated with indicated concentration of abiraterone for 96 h. The number of viable cells were counted by trypan blue exclusion assay. The experiment was performed in triplicates and two biological replicates. b C4-2B cells described above were implanted subcutaneously in male SCID mice with n = 6 in WT SREBF1 group and n = 7 mice in the double mutant group. When tumors became palpable, mice were orally gavaged with abiraterone for twice a week; total 8 doses were performed. Tumor volumes were measured with calipers. c Tumors were excised, and weights of the tumors are shown. d A photograph of the tumors is shown. e Body weights of the SCID mice during the treatment period are shown. f Immunohistochemical staining of the excised tumors was performed using SREBF1 and H2A-K130ac antibodies. Representative images from 6 samples of WT SREBF1 group and 7 samples of double mutant group are shown. Scale bar 200 μM. g TRAMP-C2 cells were implanted subcutaneously in C57BL/6 mice. When tumors became palpable, mice were orally gavaged with abiraterone or CPTH2+Afatinib for five days a week, for 3 weeks (n = 4 mice in each arm). Tumor volumes were measured with calipers. h C4-2B tumor bearing male SCID mice were orally gavaged with vehicle (10% DMSO) or abiraterone or CPTH2+Afatinib for five days a week, for 3 weeks (n = 7 mice in each group). Tumor volumes were measured with calipers. i Tumors were excised, and weights of the tumors are shown. Data are represented as mean ± SEM. For (b, c, gi), p values were determined by unpaired two-tailed Student’s t test, respectively. Source data are provided as a Source Data file.
Fig. 6
Fig. 6. SREBF1/AR interaction and its role in androgen sensing.
a HEK293T cells were transfected with FLAG-tagged AR, followed by DHT treatment for indicated time. The lysates were immunoprecipitated with FLAG antibody, followed by immunoblotting with SREBF1 antibody. b VCaP cells were DHT treated for indicated time. The lysates were immunoprecipitated with AR antibody, followed by immunoblotting with SREBF1 antibody. c HEK293T cells were transfected with FLAG-tagged AR and His-tagged SREBF1 and Y673/951A double mutant constructs, followed by DHT treatment. The lysates were immunoprecipitated with Ni-NTA beads (His), followed by immunoblotting with FLAG antibody. d TRAMP tumor bearing C57BL/6 mice orally gavaged with abiraterone or CPTH2+Afatinib for five days a week, for 4 weeks. The blood was collected, and serum androgen levels were determined. e Tumors were excised from mice and weighed (n = 3 tumors in each arm). f Tumors were excised, and the lysates were immunoprecipitated with H2A-K130ac antibody, followed by immunoblotting with H2A antibody (top panel). Also, lysates were immunoprecipitated with SREBF1, followed by immunoblotting with pTyr antibody (second panel). g RNA isolated from TRAMP-C2 tumors and were subjected to qRT-PCR with indicated primers. (n = 3, 2 replicates). h Flow cytometric analysis of splenocytes isolated from tumor bearing mice was done to assess CD3+ T cell populations (n = 3 mice in each group). i, j, h Flow cytometric analysis of lymphocytes from tumor draining lymph nodes of mice implanted with TRAMP-C2 cells was done to assess CD8 populations with exhaustion markers (n = 3 mice in each group). k Serum interferon-γ levels were assessed by ELISA (n = 3 mice in each group). l Representative calcium flux of splenocytes isolated from C57BL/6 mice treated with vehicle or DHT for 1 h. m Jurkat cells were treated with DHT for indicated time, followed by fractionation. Immunoblotting of nuclear and cytosolic fractions was performed with indicated antibodies. For (ac, f), and (m) representative images are as shown (n = 3 biologically independent experiments). For (e, gk), data are represented as mean ± SEM. p values were determined by unpaired two-tailed Student’s t test, respectively. Source data are provided as a Source Data file.
Fig. 7
Fig. 7. Increased levels of nuclear SREBF1 and H2A-K130ac epigenetic marks in stage IV prostate cancer.
a Representative images of prostate tissue microarray (TMA) sections immunohistochemical stained with SREBF1 and H2A-K130ac antibody (n = 80 cores per slide). Scale bar 200 μM. b, c Box plots summarizing distributions of staining intensities for H2A-K130ac and SREBF1 (nuclear) in different stages of prostate cancer, Stage I to IV. Each box has lines at the lower quartile (25%), median (50%), and upper quartile values (75%). Whiskers extend from each end of the box to the most extreme values within 1.5 times the interquartile range from the ends of the box. The data with values beyond the ends of the whiskers, displayed as circles, are potential outliers. d Expression levels between H2A-K130ac and SREBF1 (nuclear) were significantly correlated in prostate tumors (n = 80 cores). For (b and c), p values were determined by Kruskal–Wallis test. For (d), the black line is the fitted linear line with 95% confidence interval bands shaded in pink. Source data are provided as a Source Data file.
Fig. 8
Fig. 8. pY-SREBF1/H2A-K130ac signaling senses androgen deficiency and regulates de novo androgen biosynthesis, a model.
Prostate cancer senses androgen by SREBF1 forming complex with androgen-bound-AR, preventing its nuclear localization. In androgen deficient environment, SREBF1 dissociated from androgen-unbound-AR, phosphorylated by tyrosine kinases, allowing its nuclear translocation, followed by recruitment of KAT2A to deposit acK130-H2A epigenetic marks in SREBF1 exons. Epigenetic marking promoted SREBF1 transcription, which in turn initiated cholesterologenic program, resulting in de novo androgen biosynthesis. Tumor derived androgen acted in paracrine manner on T cells, retaining SREBF1-androgen bound AR complex in cytosol, promoting T cell exhaustion.

References

    1. Locke JA, et al. Androgen levels increase by intratumoral de novo steroidogenesis during progression of castration-resistant prostate cancer. Cancer Res. 2008;68:6407–6415. - PubMed
    1. Nishiyama T, Hashimoto Y, Takahashi K. The influence of androgen deprivation therapy on dihydrotestosterone levels in the prostatic tissue of patients with prostate cancer. Clin. Cancer Res. 2004;10:7121–7126. - PubMed
    1. Titus MA, Schell MJ, Lih FB, Tomer KB, Mohler JL. Testosterone and dihydrotestosterone tissue levels in recurrent prostate cancer. Clin. Cancer Res. 2005;11:4653–4657. - PubMed
    1. Nishiyama T, Ikarashi T, Hashimoto Y, Wako K, Takahashi K. The change in the dihydrotestosterone level in the prostate before and after androgen deprivation therapy in connection with prostate cancer aggressiveness using the Gleason score. J. Urol. 2007;178:1282–1288. - PubMed
    1. Montgomery RB, et al. Maintenance of intratumoral androgens in metastatic prostate cancer: a mechanism for castration-resistant tumor growth. Cancer Res. 2008;68:4447–4454. - PMC - PubMed

Publication types