. 2023 Jun 9;6(1):623.
doi: 10.1038/s42003-023-05004-9.

Y chromosome sequence and epigenomic reconstruction across human populations

Affiliations

Y chromosome sequence and epigenomic reconstruction across human populations

Paula Esteller-Cucala et al. Commun Biol. .

Abstract

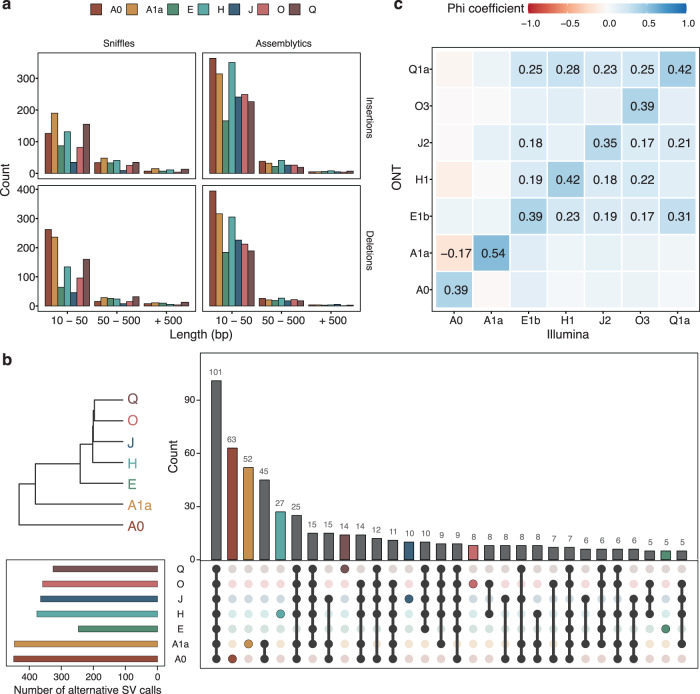
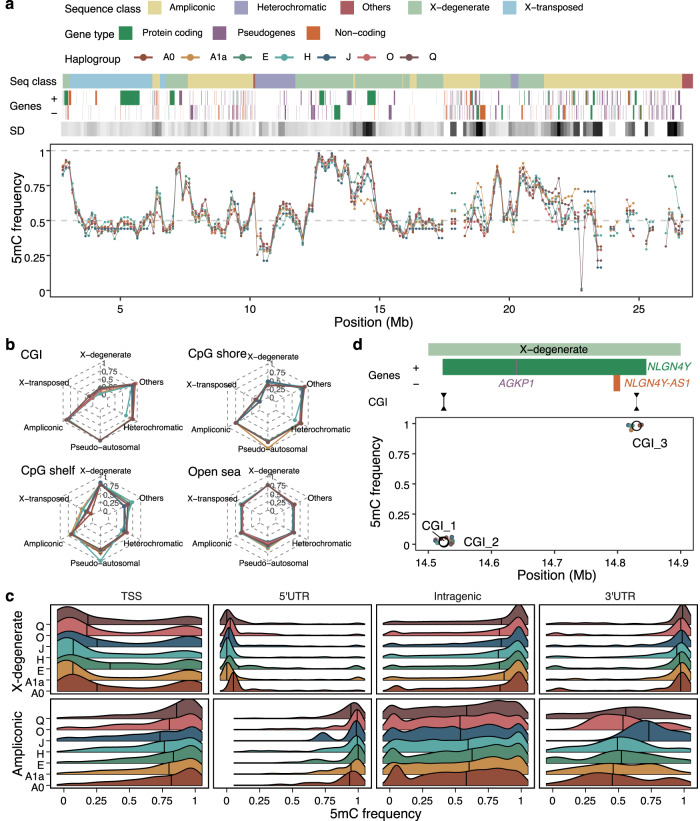
Recent advances in long-read sequencing technologies have allowed the generation and curation of more complete genome assemblies, enabling the analysis of traditionally neglected chromosomes, such as the human Y chromosome (chrY). Native DNA was sequenced on a MinION Oxford Nanopore Technologies sequencing device to generate genome assemblies for seven major chrY human haplogroups. We analyzed and compared the chrY enrichment of sequencing data obtained using two different selective sequencing approaches: adaptive sampling and flow cytometry chromosome sorting. We show that adaptive sampling can produce data to create assemblies comparable to chromosome sorting while being a less expensive and time-consuming technique. We also assessed haplogroup-specific structural variants, which would be otherwise difficult to study using short-read sequencing data only. Finally, we took advantage of this technology to detect and profile epigenetic modifications among the considered haplogroups. Altogether, we provide a framework to study complex genomic regions with a simple, fast, and affordable methodology that could be applied to larger population genomics datasets.


Conflict of interest statement

L.F.K.K. is currently an employee of Illumina Inc. All other authors declare no competing interests.

Figures

Fig. 1
Fig. 1. Study design, enrichment factor, and assemblies.
a Summary of the samples, methodologies, and analyses used in the study. b Phylogenetic tree of the human Y chromosomes used in the study. Split times are taken from Jobling and Tyler-Smith. kya, kilo years ago. c Enrichment factor values of the H haplogroup from data generated using chromosome sorting and adaptive sampling. The chrY shows higher enrichment with chromosome sorting than adaptive sampling for the haplogroup compared. The dashed vertical line equal to 1 denotes no chromosomal enrichment. For the autosomal chromosomes, the mean enrichment value is displayed, and error bars represent the standard deviation (n = 22 autosomal chromosomes). d Dot-plots of the manually scaffolded Y chromosomes compared to the resolved MSY region of GRCh38. The large-scale deletion in the J haplogroup is most likely due to its low coverage. Source data are provided in Supplementary Data 8.
Fig. 2
Fig. 2. Profiling of structural variants.
a Number of the structural variant events, insertions, and deletions called by Sniffles or Assemblytics for the different haplogroups. Variants are grouped into three categories depending on their length: from 10 up to 50 bp, from 50 up to 500 bp, and equal to or over 500 bp. b Overlap on the alternative calls between haplogroups. As expected by their evolutionary distance, haplogroups A0 and A1a show higher haplogroup-specific variants. Only variants with genotype calls for all haplogroups have been included (n = 726 variants). c Correlations between genotype calls using Sniffles (ONT-based) or graphtyper (Illumina-based) when calling the same set of structural variants. Phi coefficients range from 1 to −1, where 1 indicates complete association. Only correlation values that are statistically significant (p-value < 0.05) after Bonferroni multiple testing correction are shown. Source data are provided in Supplementary Data 8.
Fig. 3
Fig. 3. Methylation landscape across the Y chromosome phylogeny.
a Frequency of 5mC in the seven cell lines along the resolved MSY of the GRCh38. The methylation levels are calculated as the median 5mC frequency value in 250 kb sliding windows for each cell line. The sequence classes, the genes annotated, and the standard deviation (SD) of the methylation levels across cell lines are also shown. The standard deviation of the 5mC frequency is represented in a white-to-black scale, in which a darker color denotes a higher standard deviation value. b Median methylation value per cell line segregated by CpG annotation and sequence classes. CpG annotations are mutually exclusive regions that comprise: CpG islands (CGI), CpG shores (up to 2 kb away from the end of the CGI), CpG shelves (up to 2 kb away from the end of the CpG shores), and inter-CGI or open sea regions (where all remaining CpG are allocated). c 5mC frequencies on different gene features in X-degenerate and ampliconic sequence classes. Gene annotation features shown are TSS (region of 200 bp upstream of the transcription start site), both UTRs, and intragenic regions (which combine all exonic and intronic regions without considering the first gene exon). Extended version with the number of CpG sites in Supplementary Figs. 24 and 25. d Methylation frequencies in 3 CpG islands (CGI) surrounding the NLGN4Y and NLGN4Y-AS1 genes. Empty circles show the mean 5mC frequency per CGI, whereas smaller colored points indicate the individual value in each cell line. Source data are provided in Supplementary Data 8.

References

    1. Accounting for sex in the genome. Nat. Med.23, 1243 10.1038/nm.4445 (2017). - PubMed
    1. Wise AL, Gyi L, Manolio TA. eXclusion: toward integrating the X chromosome in genome-wide association analyses. Am. J. Hum. Genet. 2013;92:643–647. doi: 10.1016/j.ajhg.2013.03.017. - DOI - PMC - PubMed
    1. Wilson, M. A. The Y chromosome and its impact on health and disease. Hum. Mol. Genet.30, R296–R300 (2021). - PMC - PubMed
    1. Anderson, K., Cañadas-Garre, M., Chambers, R., Maxwell, A. P. & McKnight, A. J. The challenges of chromosome Y analysis and the implications for chronic kidney disease. Front. Genet.10, 781 (2019). - PMC - PubMed
    1. Molina, E., Clarence, E. M., Ahmady, F., Chew, G. S. & Charchar, F. J. Coronary artery disease: why we should consider the Y chromosome. Heart Lung Circ.25, 791–801 (2016). - PubMed

Publication types