. 2023 Jun 9;25(1):64.
doi: 10.1186/s13058-023-01667-8.

Studying the association between longitudinal mammographic density measurements and breast cancer risk: a joint modelling approach

Affiliations

Studying the association between longitudinal mammographic density measurements and breast cancer risk: a joint modelling approach

Maya Illipse et al. Breast Cancer Res. .

Abstract

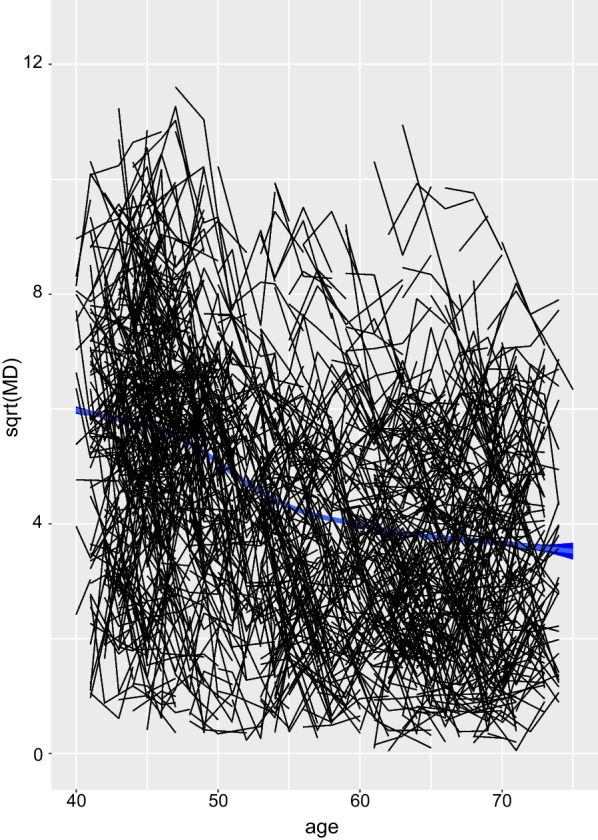
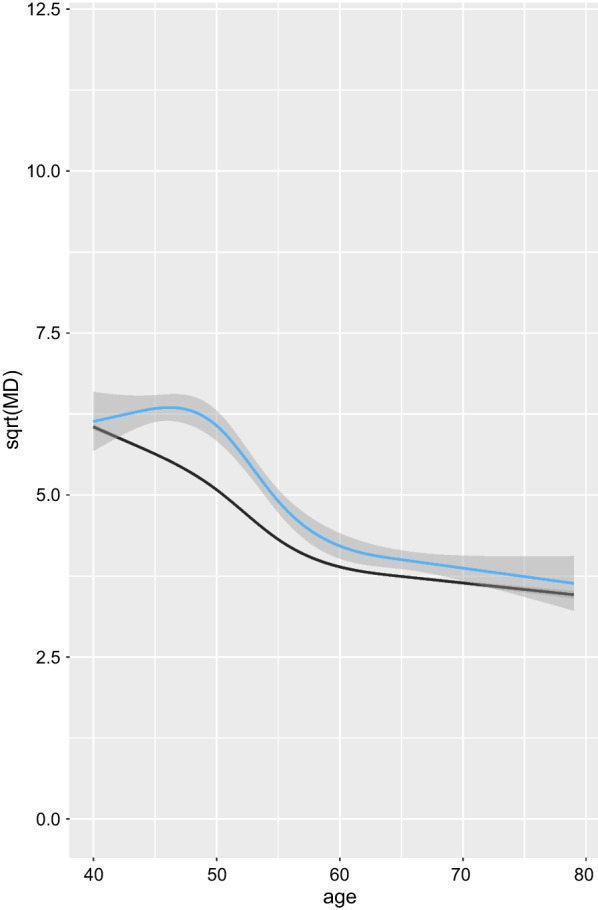
Background: Researchers have suggested that longitudinal trajectories of mammographic breast density (MD) can be used to understand changes in breast cancer (BC) risk over a woman's lifetime. Some have suggested, based on biological arguments, that the cumulative trajectory of MD encapsulates the risk of BC across time. Others have tried to connect changes in MD to the risk of BC.

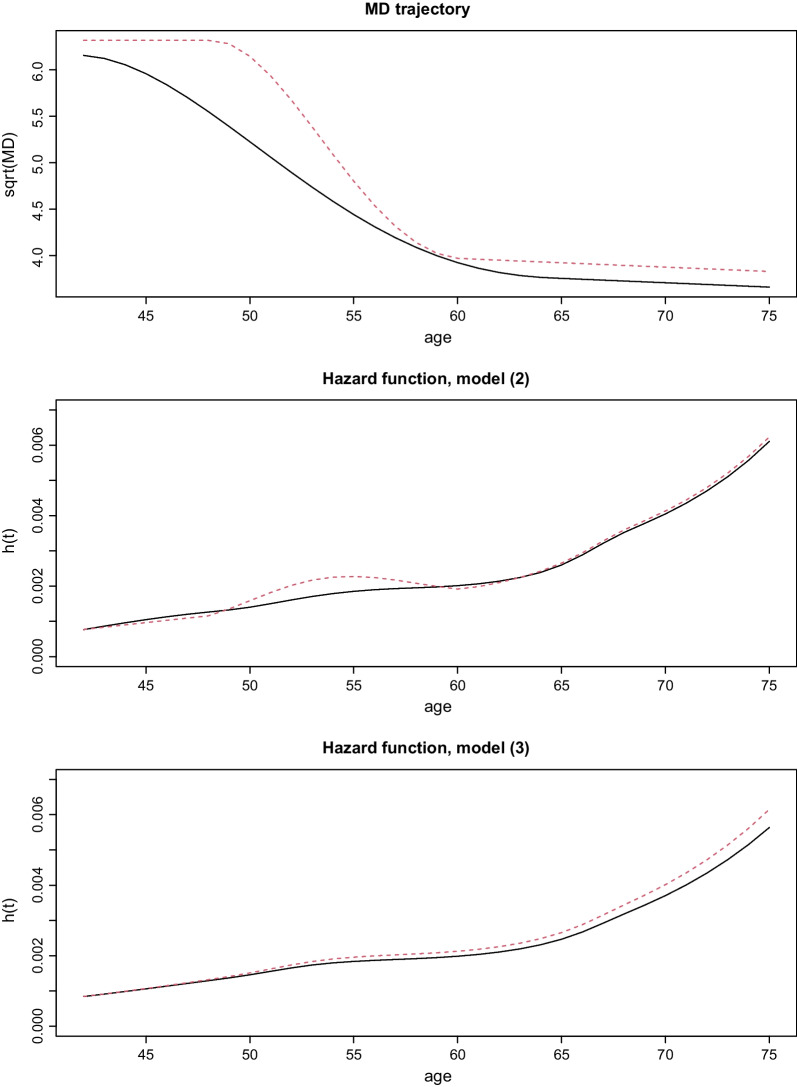
Methods: To summarize the MD-BC association, we jointly model longitudinal trajectories of MD and time to diagnosis using data from a large ([Formula: see text]) mammography cohort of Swedish women aged 40-80 years. Five hundred eighteen women were diagnosed with BC during follow-up. We fitted three joint models (JMs) with different association structures; Cumulative, current value and slope, and current value association structures.

Results: All models showed evidence of an association between MD trajectory and BC risk ([Formula: see text] for current value of MD, [Formula: see text] and [Formula: see text] for current value and slope of MD respectively, and [Formula: see text] for cumulative value of MD). Models with cumulative association structure and with current value and slope association structure had better goodness of fit than a model based only on current value. The JM with current value and slope structure suggested that a decrease in MD may be associated with an increased (instantaneous) BC risk. It is possible that this is because of increased screening sensitivity rather than being related to biology.

Conclusion: We argue that a JM with a cumulative association structure may be the most appropriate/biologically relevant model in this context.

Keywords: Breast cancer; Joint model; Longitudinal study; Mammographic density trajectory.


Conflict of interest statement

The authors declare that they have no competing interests.

Figures

Fig. 1
Fig. 1
MD trajectory with age. Smoothed average (square root) MD values (all women), with age (the line is encapsulated within a 95% confidence band marked in blue), and individual trajectories of (square root) MD for a sample of 1000 women (black)
Fig. 2
Fig. 2
Smoothed average (square root) predicted MD values. Smoothed average (square root) predicted MD values (from model (3)), by age, for women diagnosed with BC at the end of follow-up (with 95% confidence band marked by shading in blue), and for women that remained free from BC diagnosis until the end of follow-up (in black—the confidence band is not represented since it is very narrow, comparable to that based on observed MD values for all women, represented in Fig. 1)
Fig. 3
Fig. 3
Predicted hazard functions for the two hypothetical individuals. Trajectories of (square root) MD of two hypothetical individuals in the upper panel. Predicted hazard functions for the two individuals, based on fitted models (2) and (3), are displayed in the middle and lower panel, respectively

Similar articles

Cited by

References

    1. Boyd NF, Guo H, Martin LJ, Sun L, Stone J, Fishell E, Jong RA, Hislop G, Chiarelli A, Minkin S, et al. Mammographic density and the risk and detection of breast cancer. N Engl J Med. 2007;356(3):227–236. doi: 10.1056/NEJMoa062790. - DOI - PubMed
    1. Palomares MR, Machia JR, Lehman CD, Daling JR, McTiernan A. Mammographic density correlation with Gail model breast cancer risk estimates and component risk factors. Cancer Epidemiol Prev Biomark. 2006;15(7):1324–1330. doi: 10.1158/1055-9965.EPI-05-0689. - DOI - PubMed
    1. Vachon CM, Van Gils CH, Sellers TA, Ghosh K, Pruthi S, Brandt KR, Pankratz VS. Mammographic density, breast cancer risk and risk prediction. Breast Cancer Res. 2007;9(6):217. doi: 10.1186/bcr1829. - DOI - PMC - PubMed
    1. Yaghjyan L, Colditz GA, Rosner B, Tamimi RM. Mammographic breast density and subsequent risk of breast cancer in postmenopausal women according to the time since the mammogram. Cancer Epidemiol Prev Biomark. 2013;22(6):1110–1117. doi: 10.1158/1055-9965.EPI-13-0169. - DOI - PMC - PubMed
    1. Lynge E, Vejborg I, Andersen Z, von Euler-Chelpin M, Napolitano G. Mammographic density and screening sensitivity, breast cancer incidence and associated risk factors in danish breast cancer screening. J Clin Med. 2019;8(11):2021. doi: 10.3390/jcm8112021. - DOI - PMC - PubMed

Publication types