. 2023 Jun 9;15(1):97.
doi: 10.1186/s13148-023-01501-0.

ATHENA: an independently validated autophagy-related epigenetic prognostic prediction model of head and neck squamous cell carcinoma

Affiliations

ATHENA: an independently validated autophagy-related epigenetic prognostic prediction model of head and neck squamous cell carcinoma

Ziang Xu et al. Clin Epigenetics. .

Abstract

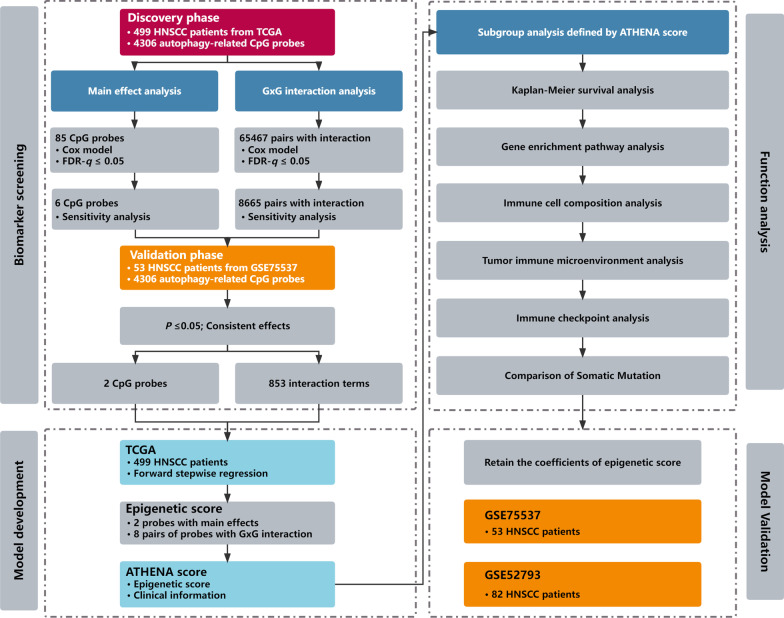
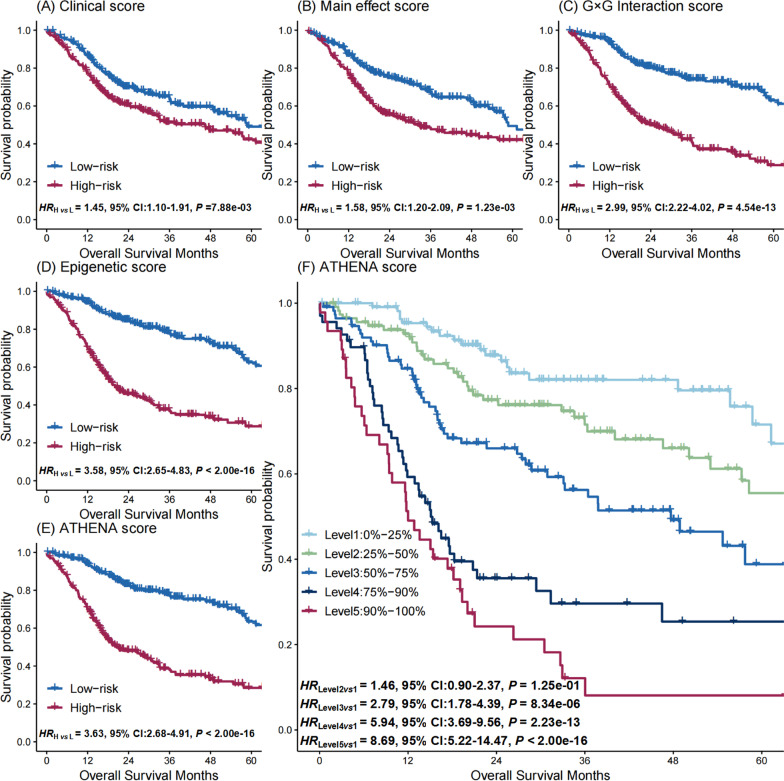
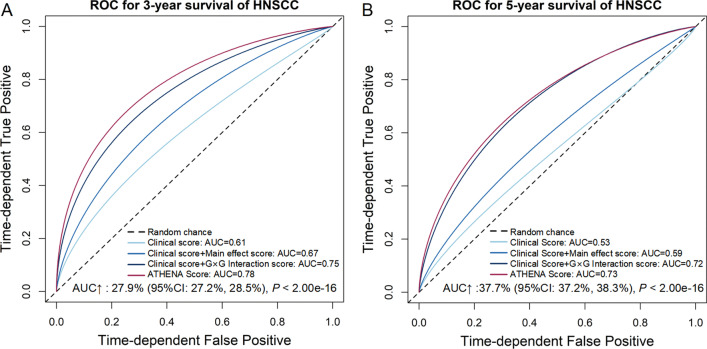
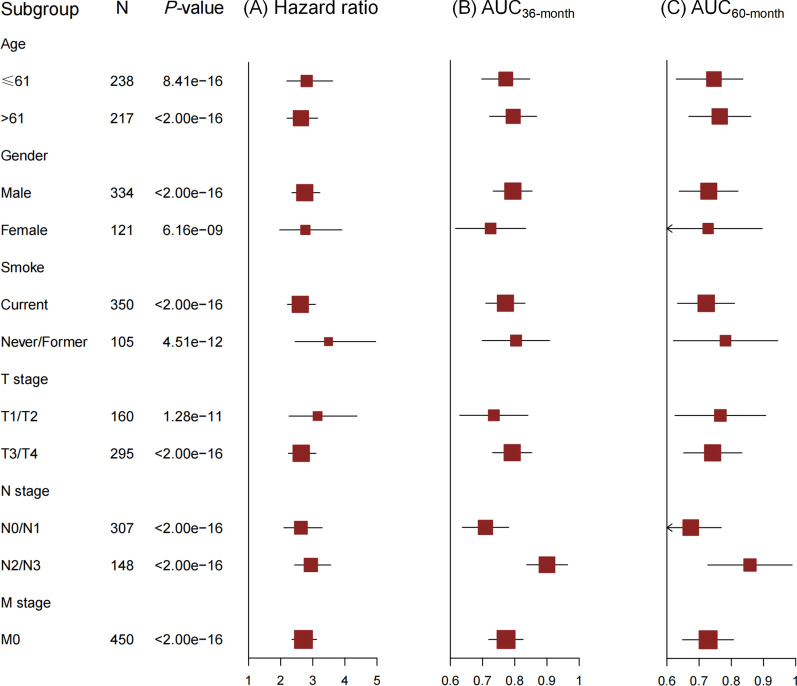
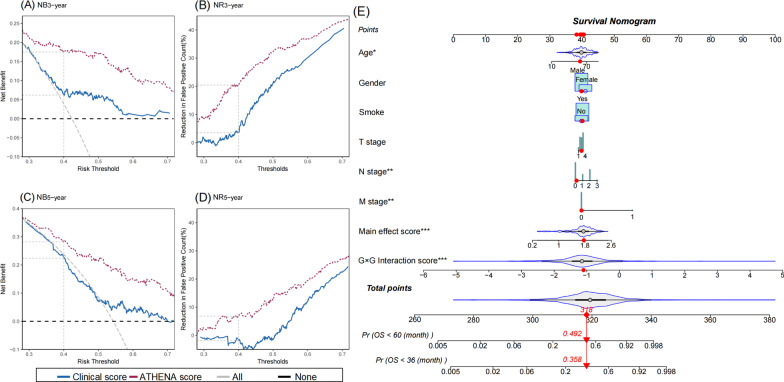
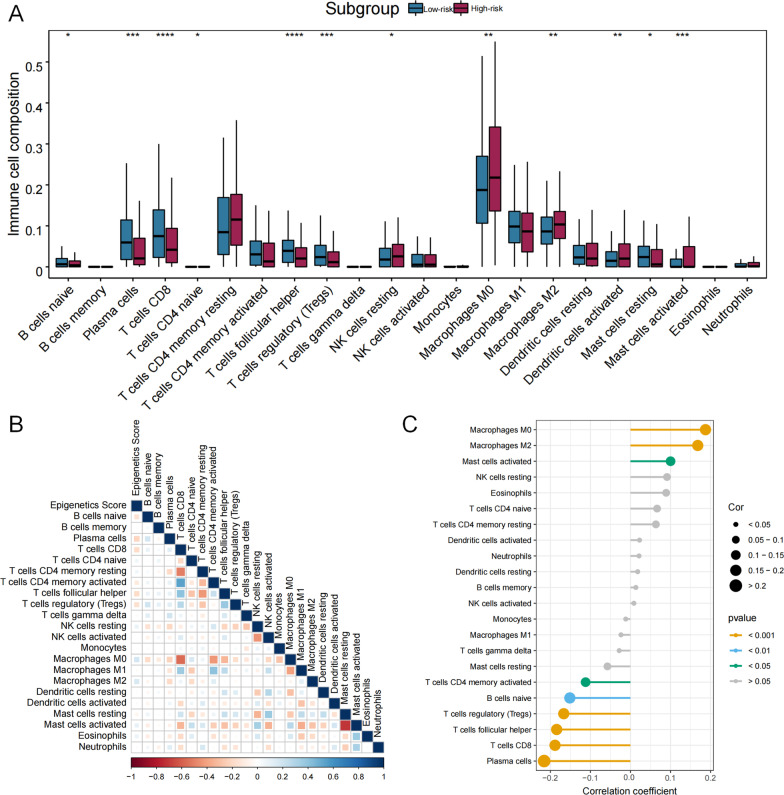
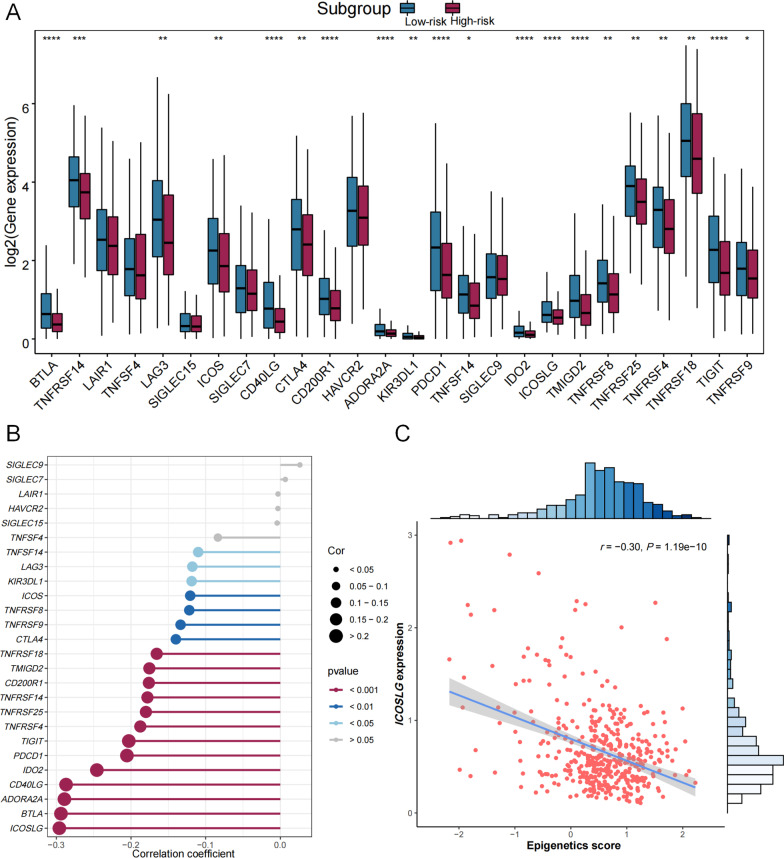
The majority of these existing prognostic models of head and neck squamous cell carcinoma (HNSCC) have unsatisfactory prediction accuracy since they solely utilize demographic and clinical information. Leveraged by autophagy-related epigenetic biomarkers, we aim to develop a better prognostic prediction model of HNSCC incorporating CpG probes with either main effects or gene-gene interactions. Based on DNA methylation data from three independent cohorts, we applied a 3-D analysis strategy to develop An independently validated auTophagy-related epigenetic prognostic prediction model of HEad and Neck squamous cell carcinomA (ATHENA). Compared to prediction models with only demographic and clinical information, ATHENA has substantially improved discriminative ability, prediction accuracy and more clinical net benefits, and shows robustness in different subpopulations, as well as external populations. Besides, epigenetic score of ATHENA is significantly associated with tumor immune microenvironment, tumor-infiltrating immune cell abundances, immune checkpoints, somatic mutation and immunity-related drugs. Taken together these results, ATHENA has the demonstrated feasibility and utility of predicting HNSCC survival ( http://bigdata.njmu.edu.cn/ATHENA/ ).

Keywords: Autophagy; DNA methylation; Gene–gene interaction; Head and neck squamous cell carcinoma; Immune landscape; Prognostic prediction.


Conflict of interest statement

The authors declare that they have no conflict of interest.

Figures

Fig. 1
Fig. 1
Flow chart of study design and statistical analyses
Fig. 2
Fig. 2
Kaplan–Meier survival curves for high- and low-risk HNSCC patients. The high- and low risk groups are defined by the median of A clinical score, B main effect score, C G × G interaction score, D epigenetic score, and E ATHENA score. F Discriminative ability of the ATHENA score is illustrated by Kaplan–Meier survival curves of six groups, defined by quantiles at 20%, 40%, 60%, 80% and 90% of ATHENA score
Fig. 3
Fig. 3
ROC curves of different prognostic prediction models using different combinations of clinical information, epigenetic predictors with main effects and G × G interactions. ROC curves are presented for both A 36-month and B 60-month survival prediction. The AUC increase (%) is evaluated by comparing ATHENA model and the model with only covariates. P values and 95% CIs are calculated by using 1000 bootstrap samples
Fig. 4
Fig. 4
Subgroup analyses of ATHENA score. A Hazard ratio is used to evaluate the association between ATHENA score and HNSCC survival. The AUC is used to measure the prediction accuracy of ATHENA for B 36-month and C 60-month survival
Fig. 5
Fig. 5
Decision curve analysis and nomogram of ATHENA. The net benefit (NB) and net reduction (NR) of patients avoided unnecessary interventions are given at threshold (0.4) for both 36-month (A, B) and 60-month (C, D) survival. E For the nomogram of ATHENA model, the value of each predictor can be converted into the corresponding points according to the axis in the top of nomogram. The sum of points for each predictor can correspond to the total points axis at the bottom of the nomogram and further be used to estimate the patient's 36- and 60-month survival rate
Fig. 6
Fig. 6
Significant pathways with genes trans-regulated by epigenetic predictors of ATHENA in gene enrichment pathway analysis. A The top 15 significant KEGG pathways, B the top 15 significant biological process pathways, C the top 10 significant cellular component pathways, and D the top 10 significant molecular function pathways were sorted by enrichment ratio
Fig. 7
Fig. 7
The association analysis between immune cells and epigenetic score of ATHENA. A The abundances of 22 immune cells are compared between high- and low- risk-groups. * means P < 0.05, ** means P < 0.01, *** means P < 0.001 and **** means P < 0.0001. B The correlation coefficients between immune cells and epigenetic score of ATHENA are derived from Pearson correlation analyses and are presented in a heatmap. C The correlation coefficients between immune cells and epigenetic score of ATHENA are derived from Pearson correlation analyses and these pairs are listed in lollipop chart
Fig. 8
Fig. 8
The association analysis between immune checkpoints and epigenetic score of ATHENA. A The gene expressions of 26 immune checkpoints are compared between high- and low-risk-groups. * means P < 0.05, ** means P < 0.01, *** means P < 0.001 and **** means P < 0.0001. B The correlation coefficients between immune checkpoints and epigenetic score of ATHENA are derived from Pearson correlation analyses and these pairs are listed in lollipop chart. C The scatter plot and linear regression analysis between epigenetic score of ATHENA and expression of ICOSLG with the strongest association
Fig. 9
Fig. 9
Waterfall plots of the top 20 somatic mutated genes in high- and low-risk groups. A The high-risk and B the low-risk group are defined by the median of the epigenetic score of ATHENA

Similar articles

Cited by

References

    1. Sung H, Ferlay J, Siegel RL, Laversanne M, Soerjomataram I, Jemal A, et al. Global cancer statistics 2020: GLOBOCAN estimates of incidence and mortality worldwide for 36 cancers in 185 countries. CA Cancer J Clin. 2021;71(3):209–249. doi: 10.3322/caac.21660. - DOI - PubMed
    1. Zhao X, Chen H, Qiu Y, Cui L. FAM64A promotes HNSCC tumorigenesis by mediating transcriptional autoregulation of FOXM1. Int J Oral Sci. 2022;14(1):25. doi: 10.1038/s41368-022-00174-4. - DOI - PMC - PubMed
    1. Le Naour J, Sztupinszki Z, Carbonnier V, Casiraghi O, Marty V, Galluzzi L, et al. A loss-of-function polymorphism in ATG16L1 compromises therapeutic outcome in head and neck carcinoma patients. Oncoimmunology. 2022;11(1):2059878. doi: 10.1080/2162402X.2022.2059878. - DOI - PMC - PubMed
    1. Hsieh YP, Chen KC, Chen MY, Huang LY, Su AY, Chiang WF, et al. Epigenetic deregulation of protein tyrosine kinase 6 promotes carcinogenesis of oral squamous cell carcinoma. Int J Mol Sci. 2022;23(9):4495. doi: 10.3390/ijms23094495. - DOI - PMC - PubMed
    1. Li J, Yan T, Wu X, Ke X, Li X, Zhu Y, et al. Aberrant overexpression of transcription factor Forkhead box D1 predicts poor prognosis and promotes cancer progression in HNSCC. BMC Cancer. 2021;21(1):1205. doi: 10.1186/s12885-021-08868-4. - DOI - PMC - PubMed

Publication types