. 2023 May 27;12(11):1489.
doi: 10.3390/cells12111489.

scViewer: An Interactive Single-Cell Gene Expression Visualization Tool

Affiliations

scViewer: An Interactive Single-Cell Gene Expression Visualization Tool

Abhijeet R Patil et al. Cells. .

Abstract

Single-cell RNA sequencing (scRNA-seq) is an attractive technology for researchers to gain valuable insights into the cellular processes and cell type diversity present in all tissues. The data generated by the scRNA-seq experiment are high-dimensional and complex in nature. Several tools are now available to analyze the raw scRNA-seq data from public databases; however, simple and easy-to-explore single-cell gene expression visualization tools focusing on differential expression and co-expression are lacking. Here, we present scViewer, an interactive graphical user interface (GUI) R/Shiny application designed to facilitate the visualization of scRNA-seq gene expression data. With the processed Seurat RDS object as input, scViewer utilizes several statistical approaches to provide detailed information on the loaded scRNA-seq experiment and generates publication-ready plots. The major functionalities of scViewer include exploring cell-type-specific gene expression, co-expression analysis of two genes, and differential expression analysis with different biological conditions considering both cell-level and subject-level variations using negative binomial mixed modeling. We utilized a publicly available dataset (brain cells from a study of Alzheimer's disease to demonstrate the utility of our tool. scViewer can be downloaded from GitHub as a Shiny app with local installation. Overall, scViewer is a user-friendly application that will allow researchers to visualize and interpret the scRNA-seq data efficiently for multi-condition comparison by performing gene-level differential expression and co-expression analysis on the fly. Considering the functionalities of this Shiny app, scViewer can be a great resource for collaboration between bioinformaticians and wet lab scientists for faster data visualizations.

Keywords: R Shiny; bioinformatics; co-expression; differential expression analysis; gene expression; scRNA-seq; single-cell RNA sequencing.


Conflict of interest statement

Teva Pharmaceuticals Industries Ltd. develops, produces, and markets affordable, high-quality generic drugs and specialty pharmaceuticals. At the time of the study, all the authors were employed by Teva Pharmaceutical Industries Ltd. The authors declare the absence of any potential conflicts of interest, such as commercial or financial relationships, pertaining to the conduction of this study.

Figures

Figure 1
Figure 1
Schematic workflow of the single-cell app, scViewer. (a) In the first part, optionally, the raw data can be processed and analyzed following our custom Seurat-based pipeline and the metadata format compatible with scViewer (dotted lines). Next, the users can use the processed Seurat object, and the scViewer app generates various plots and figures. (b) Screenshots showing the overview of the scViewer application.
Figure 2
Figure 2
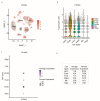
Overall expression of the PTRPG gene in the input single-cell dataset. (a) Feature plots showing the average expression of genes in the entire input dataset across cell types. (b) Violin plots showing the average gene expression across cell types in the entire input dataset. (c) Dot plot showing the average expression and percent expressed of a gene across cell types. (d) Table showing the average expression and percent expressed metrics across cell types. Astro: astrocytes, Endo: endothelial cells, Excit: excitatory neurons, Inhibit: inhibitory neurons, Mic: microglia, and Oligo: oligodendrocytes.
Figure 3
Figure 3
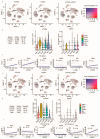
Co-expression analysis of PTPRG and P2RX7 genes in AD vs. Normal population. (a) Feature plots showing the average co-expression of PTPRG and P2RX7 genes in the AD samples. Each dot represents a cell. (b) Table depicting the number of cells and percent of cells expressing both PTPRG and P2RX7 genes in AD samples. The violin plots show the average gene expression of PTPRG and P2RX7 genes in the co-expressing cells from AD samples. Here, each dot represents a cell. (c) Scatter plots showing the correlation between the expressions of the two genes in the same co-expressing cells from AD samples. (d) Feature plots showing the average co-expression of genes in the Normal samples. (e) The table depicts the number of cells and percent of cells expressing both PTPRG and P2RX7 genes in Normal samples. The violin plots show the average gene expression of PTPRG and P2RX7 genes in the co-expressing cells from Normal samples. (f) Scatter plots showing the correlation between the expression of the two genes in the same co-expressing cells from Normal samples. Here, each dot represents a cell. Astro: astrocytes, Endo: endothelial cells, Excit: excitatory neurons, Inhibit: inhibitory neurons, Mic: microglia, and Oligo: oligodendrocytes.
Figure 4
Figure 4
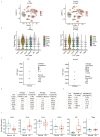
Differential expression of the PTPRG gene in the AD vs. Normal population. (a) Feature plots showing the average gene expression of the PTRPG gene in AD vs. Normal cells. Each dot represents a cell. (b) Violin plots showing a gene’s average expression of the PTRPG gene in the AD vs. Normal cells. Each dot represents a cell. (c) Dot plot showing the average expression and percent expressed of PTRPG gene in AD vs. Normal cells. Each dot represents a cell. (d) Table showing the average expression and percent expressed metrics of the PTPRG gene for cells from AD and Normal samples across cell types. (e) Table showing the differential expression for PTPRG gene using p-value and log2FC in all the cell types. (f) Boxplots showing the pseudobulk average expression of PTPRG gene in individual samples across different cell types. Astro: astrocytes, Endo: endothelial cells, Excit: excitatory neurons, Inhibit: inhibitory neurons, Mic: microglia, and Oligo: oligodendrocytes.

References

    1. Lewsey M.G., Yi C., Berkowitz O., Ayora F., Bernado M., Whelan J. scCloudMine: A cloud-based app for visualization, comparison, and exploration of single-cell transcriptomic data. Plant Commun. 2022;3:100302. doi: 10.1016/j.xplc.2022.100302. - DOI - PMC - PubMed
    1. Jagla B., Libri V., Chica C., Rouilly V., Mella S., Puceat M., Hasan M. SCHNAPPs-Single Cell sHiNy APPlication(s) J. Immunol. Methods. 2021;499:113176. doi: 10.1016/j.jim.2021.113176. - DOI - PubMed
    1. Hao Y., Hao S., Andersen-Nissen E., Mauck W.M., Zheng S., Butler A., Lee M.J., Wilk A.J., Darby C., Zager M., et al. Integrated analysis of multimodal single-cell data. Cell. 2021;184:3573–3587.e3529. doi: 10.1016/j.cell.2021.04.048. - DOI - PMC - PubMed
    1. Lun A.T.L., Bach K., Marioni J.C. Pooling across cells to normalize single-cell RNA sequencing data with many zero counts. Genome Biol. 2016;17:75. doi: 10.1186/s13059-016-0947-7. - DOI - PMC - PubMed
    1. Ouyang J.F., Kamaraj U.S., Cao E.Y., Rackham O.J.L. ShinyCell: Simple and sharable visualization of single-cell gene expression data. Bioinformatics. 2021;37:3374–3376. doi: 10.1093/bioinformatics/btab209. - DOI - PubMed

Publication types

LinkOut - more resources