. 2023 May 26;13(11):1871.
doi: 10.3390/diagnostics13111871.

Rapid Whole-Body FDG PET/MRI in Oncology Patients: Utility of Combining Bayesian Penalised Likelihood PET Reconstruction and Abbreviated MRI

Affiliations

Rapid Whole-Body FDG PET/MRI in Oncology Patients: Utility of Combining Bayesian Penalised Likelihood PET Reconstruction and Abbreviated MRI

Junko Inoue Inukai et al. Diagnostics (Basel). .

Abstract

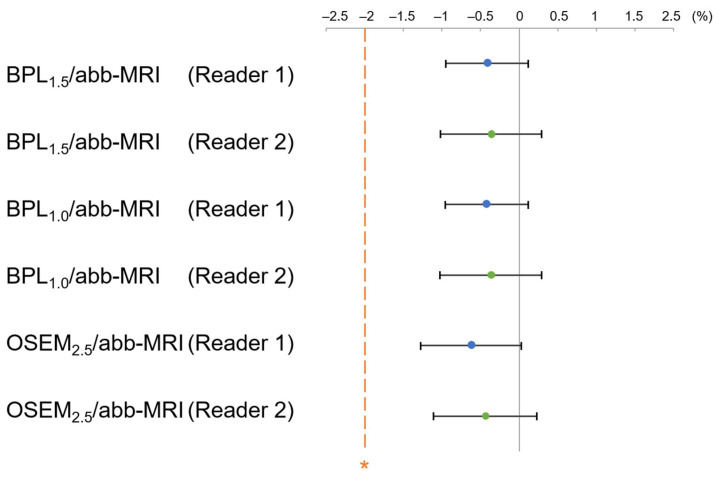
This study evaluated the diagnostic value of a rapid whole-body fluorodeoxyglucose (FDG) positron emission tomography (PET)/magnetic resonance imaging (MRI) approach, combining Bayesian penalised likelihood (BPL) PET with an optimised β value and abbreviated MRI (abb-MRI). The study compares the diagnostic performance of this approach with the standard PET/MRI that utilises ordered subsets expectation maximisation (OSEM) PET and standard MRI (std-MRI). The optimal β value was determined by evaluating the noise-equivalent count (NEC) phantom, background variability, contrast recovery, recovery coefficient, and visual scores (VS) for OSEM and BPL with β100-1000 at 2.5-, 1.5-, and 1.0-min scans, respectively. Clinical evaluations were conducted for NECpatient, NECdensity, liver signal-to-noise ratio (SNR), lesion maximum standardised uptake value, lesion signal-to-background ratio, lesion SNR, and VS in 49 patients. The diagnostic performance of BPL/abb-MRI was retrospectively assessed for lesion detection and differentiation in 156 patients using VS. The optimal β values were β600 for a 1.5-min scan and β700 for a 1.0-min scan. BPL/abb-MRI at these β values was equivalent to OSEM/std-MRI for a 2.5-min scan. By combining BPL with optimal β and abb-MRI, rapid whole-body PET/MRI could be achieved in ≤1.5 min per bed position, while maintaining comparable diagnostic performance to standard PET/MRI.

Keywords: Bayesian penalised likelihood; PET/MRI; abbreviated MRI; fluorodeoxyglucose; image reconstruction; whole-body imaging.


Conflict of interest statement

The authors declare no conflict of interest.

Figures

Figure 1
Figure 1
The whole-body positron emission tomography (PET)/magnetic resonance imaging (MRI) scan protocol requires 5 to 6 bed positions per patient to cover imaging from the upper thigh to the top of the head. During the 2.5-min emission scan of PET per one bed position, MRIs including magnetic resonance attenuation correction scan (MRAC), T1-weighted Dixon, and 3D fast spin-echo T2-weighted images (T2WI 3D-Fast Spin Echo (FSE) (Cube)) can be simultaneously acquired. For the 1.5- and 1.0-min scan, only T1-weighted Dixon (T1WI Dixon) can be simultaneously acquired. (BPL, Bayesian Penalised Likelihood).
Figure 2
Figure 2
Phantom study images were acquired using the National Electrical Manufacturers Association (NEMA) Image Quality (IQ) Phantom. In Bayesian penalised likelihood reconstruction, lower β values lead to increased background inhomogeneity and decreased delineation of the 10-mm sphere. Conversely, higher β values increase background uniformity, but also result in decreased delineation of the 10 mm sphere. (OSEM, Ordered Subsets Expectation Maximisation; BPL, Bayesian Penalised Likelihood).
Figure 3
Figure 3
The mean and 95% CI of the percent difference of LiverSNR between OSEM2.5 and each assessed reconstruction are shown. The LiverSNR at BPL1.5 with β500–800 and that at BPL1.0 with β600 and 800 were higher than the non-inferiority margin (indicated by asterisk) for OSEM2.5. (OSEM, Ordered Subsets Expectation Maximisation; BPL, Bayesian Penalised Likelihood).
Figure 4
Figure 4
The Bland-Altman plot shows the percent difference in LesionSUVmax between OSEM2.5 and the 1.5-min BPL reconstruction. The smallest mean difference in LesionSUVmax between OSEM2.5 and BPL1.5 was found with a β value of 600 (indicated by the arrow). (OSEM, Ordered Subsets Expectation Maximisation; BPL, Bayesian Penalised Likelihood).
Figure 5
Figure 5
The Bland-Altman plot for the percent difference in LesionSUVmax between OSEM2.5 and 1.0 min BPL reconstruction. The smallest mean difference in LesionSUVmax between OSEM2.5 and BPL1.0 was found with a β value of 700 (indicated by the arrow). (OSEM, Ordered Subsets Expectation Maximisation; BPL is Bayesian Penalised Likelihood).
Figure 6
Figure 6
The mean and 95% confidence interval (CI) of the percent difference of LesionSBR between OSEM2.5 and each assessed reconstruction. BPL1.5 and BPL1.0 with β values ranging from 500–800 showed higher LesionSBR than the non-inferiority margin (indicated by asterisk) for OSEM2.5. (OSEM, Ordered Subsets Expectation Maximisation; BPL, Bayesian Penalised Likelihood).
Figure 7
Figure 7
The mean and 95% confidence interval (CI) of the percent difference of LesionSNR between OSEM2.5 and each assessed reconstruction. BPL1.5 and BPL1.0 with β values ranging from 500–800 showed higher LesionSNR than the non-inferiority margin (denoted by asterisk) for OSEM2.5. (OSEM, Ordered Subsets Expectation Maximisation; BPL, Bayesian Penalised Likelihood).
Figure 8
Figure 8
The mean and 95% confidence interval (CI) of the percent difference of the visual scores of each assessed reconstruction. The visual scores for BPL1.5 with β values ranging from 500–800 and BPL1.0 with β values ranging from 600–800 were higher than the non-inferiority margin (indicated by asterisk) for OSEM2.5. (OSEM, Ordered Subsets Expectation Maximisation; BPL, Bayesian Penalised Likelihood).
Figure 9
Figure 9
A representative case with liver lesions showing (arrows) the difference in image quality by different scan durations and different β values. The optimal β values based on clinical evaluations were β600 for BPL1.5 and β700 for BPL1.0. (OSEM, Ordered Subsets Expectation Maximisation; BPL, Bayesian Penalised Likelihood).
Figure 10
Figure 10
The mean and 95% confidence interval (CI) of the percent area-under-the-curve difference for the detection capability between OSEM2.5/std-MRI and each assessed combination of positron emission tomography and magnetic resonance imaging (MRI). The detection capability for OSEM2.5/abb-MRI, BPL1.5/abb-MRI, and BPL1.0/abb-MRI were higher than the non-inferiority margin (indicated by asterisk) for OSEM2.5/std-MRI in both readers. (OSEM, Ordered Subsets Expectation Maximisation; BPL, Bayesian Penalised Likelihood).
Figure 11
Figure 11
The receiver operating characteristic curve for the differentiation capability between benign and malignant on each combination of PET and MRI. There was no significant difference in the area under the curve for the differentiation capability between BPL1.5/abb-MRI, BPL1.0/abb-MRI, OSEM2.5/abb-MRI, and OSEM2.5/std-MRI for reader 1 (a) and reader 2 (b). (OSEM, Ordered Subsets Expectation Maximisation; BPL, Bayesian Penalised Likelihood.).
Figure 12
Figure 12
The mean and 95% confidence interval (CI) of the percent area-under-the-curve difference for the differentiation capability between OSEM2.5/std-MRI and each assessed combination of positron emission tomography and magnetic resonance imaging (MRI). The differentiation capability of BPL1.5/abb-MRI, BPL1.0/abb-MRI, and OSEM2.5/abb-MRI were higher than the non-inferiority margin (indicated by asterisk) for OSEM2.5/std-MRI. (OSEM, Ordered Subsets Expectation Maximisation; BPL, Bayesian Penalised Likelihood.).

References

    1. Huellner M.W., Appenzeller P., Kuhn F.P., Husmann L., Pietsch C.M., Burger I.A., Porto M., Delso G., von Schulthess G.K., Veit-Haibach P. Whole-body nonenhanced PET/MR versus PET/CT in the staging and restaging of cancers: Preliminary observations. Radiology. 2014;273:859–869. doi: 10.1148/radiol.14140090. - DOI - PubMed
    1. Nakamoto Y., Kitajima K., Toriihara A., Nakajo M., Hirata K. Recent topics of the clinical utility of PET/MRI in oncology and neuroscience. Ann. Nucl. Med. 2022;36:798–803. doi: 10.1007/s12149-022-01780-2. - DOI - PubMed
    1. Chilcott A.K., Bradley K.M., McGowan D.R. Effect of a Bayesian Penalized Likelihood PET Reconstruction Compared with Ordered Subset Expectation Maximisation on Clinical Image Quality Over a Wide Range of Patient Weights. AJR Am. J. Roentgenol. 2018;210:153–157. doi: 10.2214/AJR.17.18060. - DOI - PubMed
    1. Teoh E.J., McGowan D.R., Macpherson R.E., Bradley K.M., Gleeson F.V. Phantom and Clinical Evaluation of the Bayesian Penalized Likelihood Reconstruction Algorithm Q.Clear on an LYSO PET/CT System. J. Nucl. Med. 2015;56:1447–1452. doi: 10.2967/jnumed.115.159301. - DOI - PMC - PubMed
    1. Lindstrom E., Sundin A., Trampal C., Lindsjo L., Ilan E., Danfors T., Antoni G., Sorensen J., Lubberink M. Evaluation of Penalized-Likelihood Estimation Reconstruction on a Digital Time-of-Flight PET/CT Scanner for (18)F-FDG Whole-Body Examinations. J. Nucl. Med. 2018;59:1152–1158. doi: 10.2967/jnumed.117.200790. - DOI - PubMed

Grants and funding