

Validation of a Length-Adjusted Abdominal Arterial Calcium Score Method for Contrast-Enhanced CT Scans
- PMID: 37296786
- PMCID: PMC10252261
- DOI: 10.3390/diagnostics13111934
Validation of a Length-Adjusted Abdominal Arterial Calcium Score Method for Contrast-Enhanced CT Scans
Abstract
Background: The Agatston score on noncontrast computed tomography (CT) scans is the gold standard for calcium load determination. However, contrast-enhanced CT is commonly used for patients with atherosclerotic cardiovascular diseases (ASCVDs), such as peripheral arterial occlusive disease (PAOD) and abdominal aortic aneurysm (AAA). Currently, there is no validated method to determine calcium load in the aorta and peripheral arteries with a contrast-enhanced CT. This study validated a length-adjusted calcium score (LACS) method for contrast-enhanced CT scans.
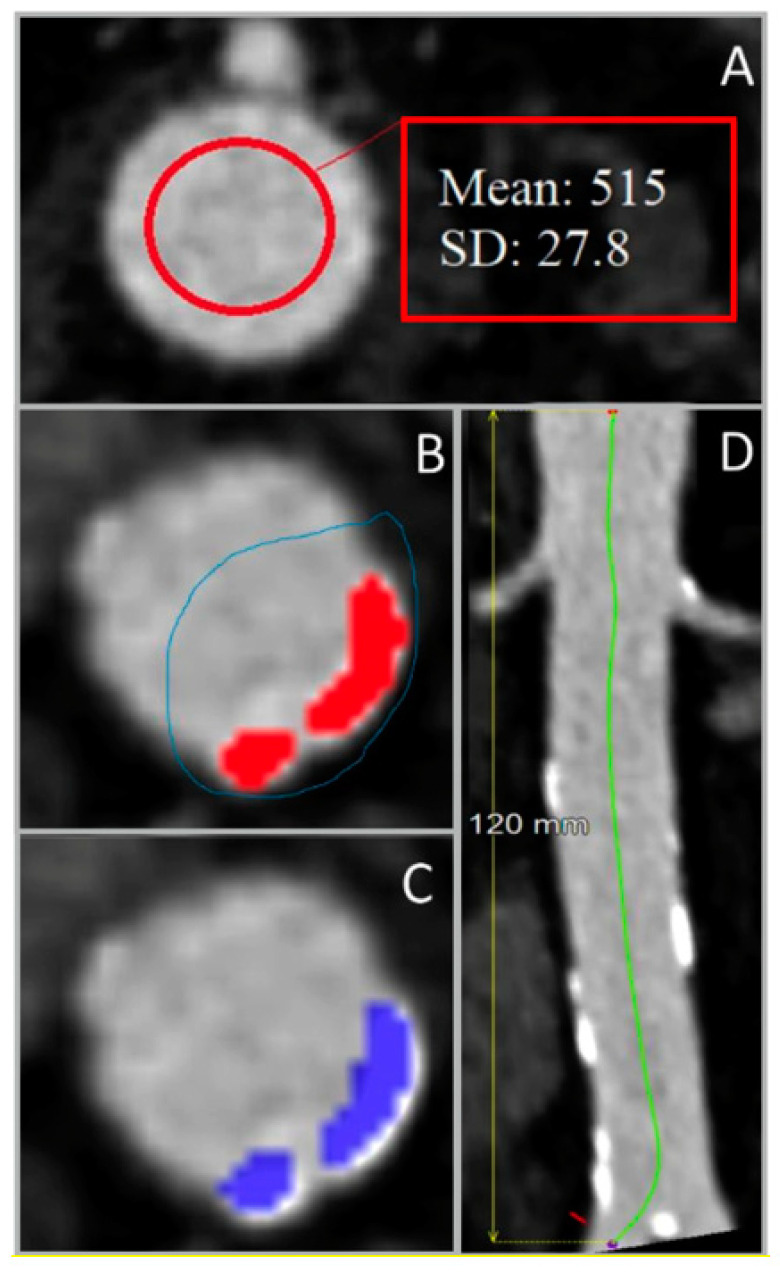
Method: The LACS (calcium volume in mm3/arterial length in cm) in the abdominal aorta was calculated using four-phase liver CT scans of 30 patients treated between 2017 and 2021 at the University Medical Center Groningen (UMCG) with no aortic disease. Noncontrast CT scans were segmented with a 130 Hounsfield units (HU) threshold, and a patient-specific threshold was used for contrast-enhanced CTs. The LACS was calculated and compared from both segmentations. Secondly, the interobserver variability and the influence of slice thickness (0.75 mm vs. 2.0 mm) was determined.
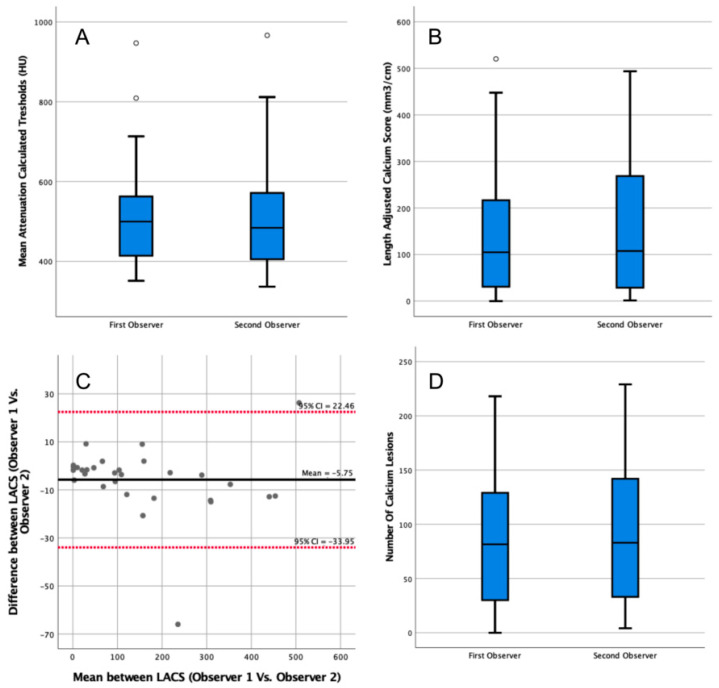
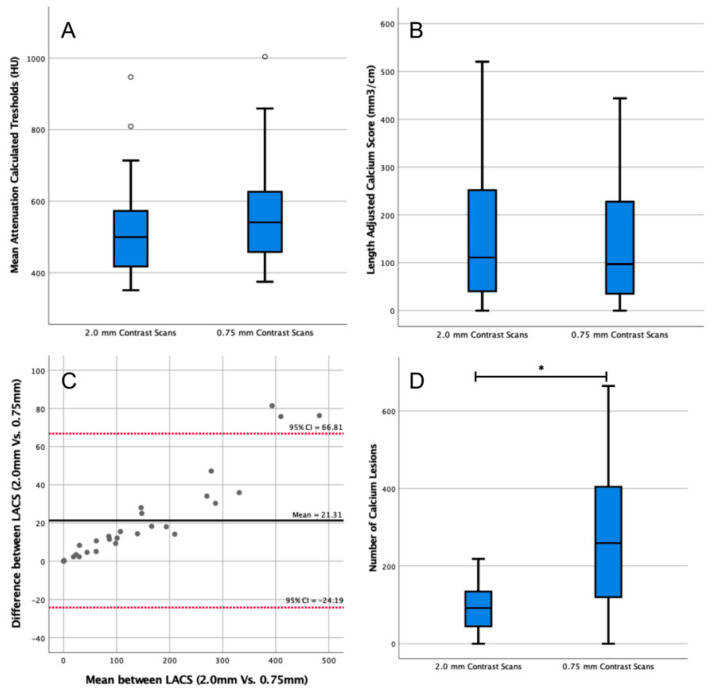
Results: There was a high correlation between the LACS from contrast-enhanced CT scans and the LACS of noncontrast CTs (R2 = 0.98). A correction factor of 1.9 was established to convert the LACS derived from contrast-enhanced CT to noncontrast CT scans. LACS interobserver agreement on contrast-enhanced CT was excellent (1.0, 95% confidence interval = 1.0-1.0). The 0.75 mm CT threshold was 541 (459-625) HU compared with 500 (419-568) HU on 2 mm CTs (p = 0.15). LACS calculated with both thresholds was not significantly different (p = 0.63).
Conclusion: The LACS seems to be a robust method for scoring calcium load on contrast-enhanced CT scans in arterial segments with various lengths.
Keywords: atherosclerosis; calcified plaques; calcium score; four-dimensional computed tomography; vascular diseases.
Conflict of interest statement
The authors declare no conflict of interest.
Figures

References
-
- Roquer J., Ois A. Handbook of Disease Burdens and Quality of Life Measures. Springer; New York, NY, USA: 2010. Atherosclerotic Burden and Mortality; pp. 899–918.
-
- Criqui M.H., Denenberg J.O., McClelland R.L., Allison M.A., Ix J.H., Guerci A., Cohoon K.P., Srikanthan P., Watson K.E., Wong N.D. Abdominal Aortic Calcium, Coronary Artery Calcium, and Cardiovascular Morbidity and Mortality in the Multi-Ethnic Study of Atherosclerosis. Arterioscler. Thromb. Vasc. Biol. 2014;34:1574–1579. doi: 10.1161/ATVBAHA.114.303268. - DOI - PMC - PubMed
-
- Gutierrez J.A., Bhatt D.L., Banerjee S., Glorioso T.J., Josey K.P., Swaminathan R.V., Maddox T.M., Armstrong E.J., Duvernoy C., Waldo S.W., et al. Risk of Obstructive Coronary Artery Disease and Major Adverse Cardiac Events in Patients with Noncoronary Atherosclerosis: Insights from the Veterans Affairs Clinical Assessment, Reporting, and Tracking (CART)Program. Am. Heart J. 2019;213:47–56. doi: 10.1016/j.ahj.2019.04.004. - DOI - PubMed
LinkOut - more resources
Full Text Sources
Medical
Research Materials
Miscellaneous
