. 2023 Jun 4;13(11):1960.
doi: 10.3390/diagnostics13111960.

Fluid-Attenuated Inversion Recovery Sequence with Fat Suppression for Assessment of Ankle Synovitis without Contrast Enhancement: Comparison with Contrast-Enhanced MRI

Affiliations

Fluid-Attenuated Inversion Recovery Sequence with Fat Suppression for Assessment of Ankle Synovitis without Contrast Enhancement: Comparison with Contrast-Enhanced MRI

Ji Hee Kang et al. Diagnostics (Basel). .

Abstract

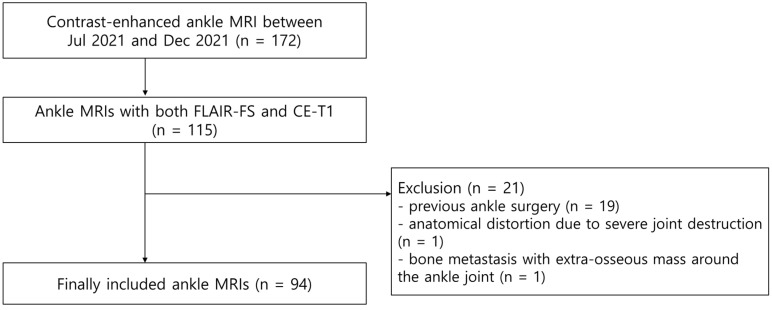
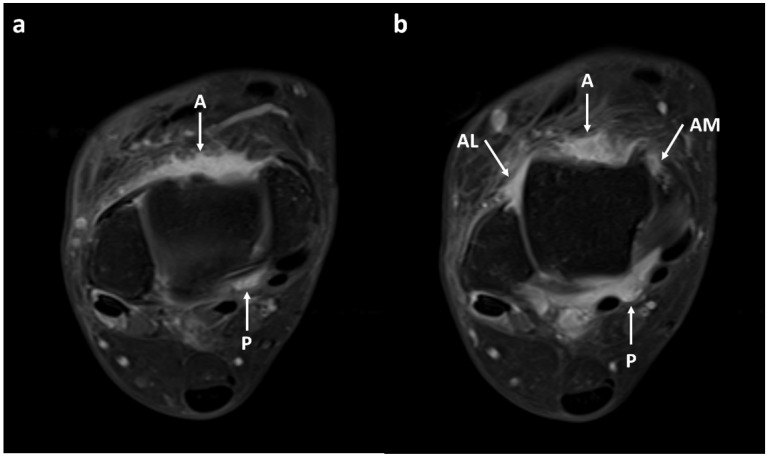
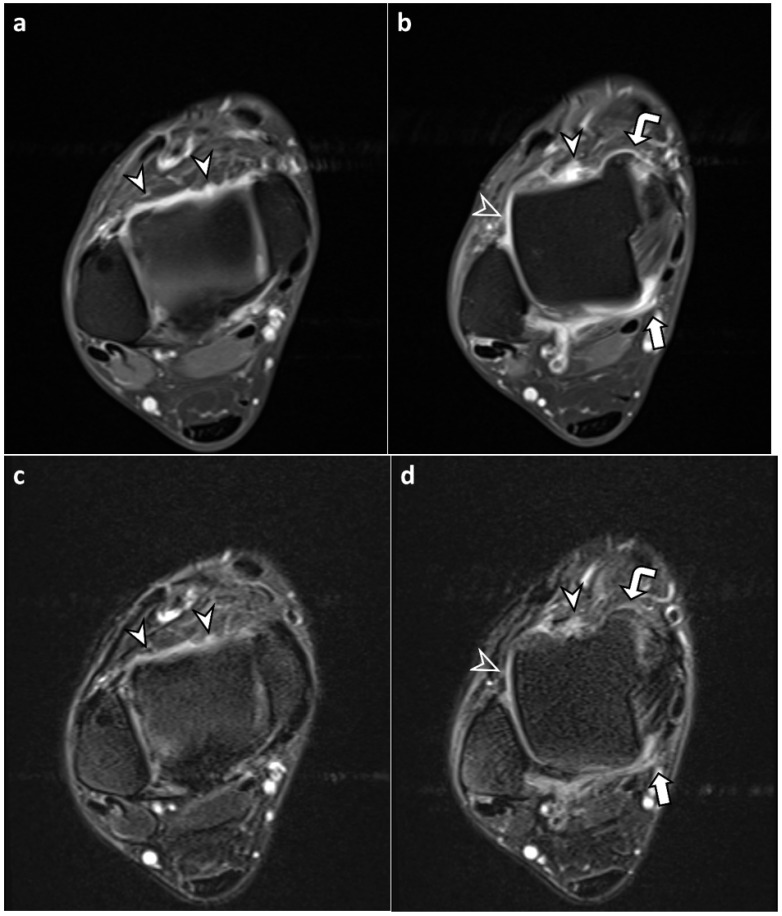
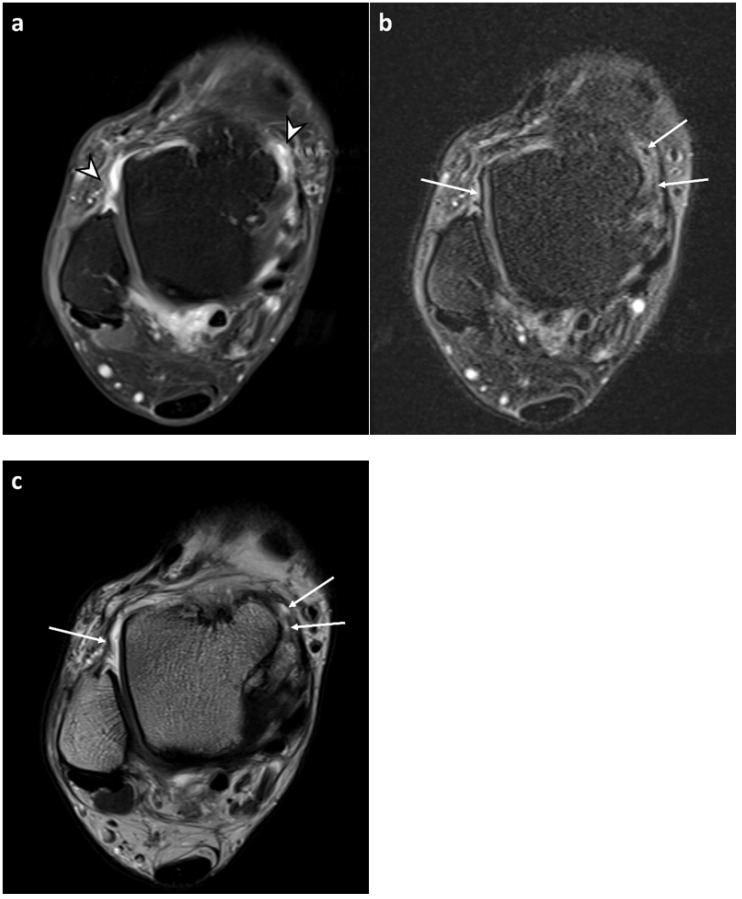
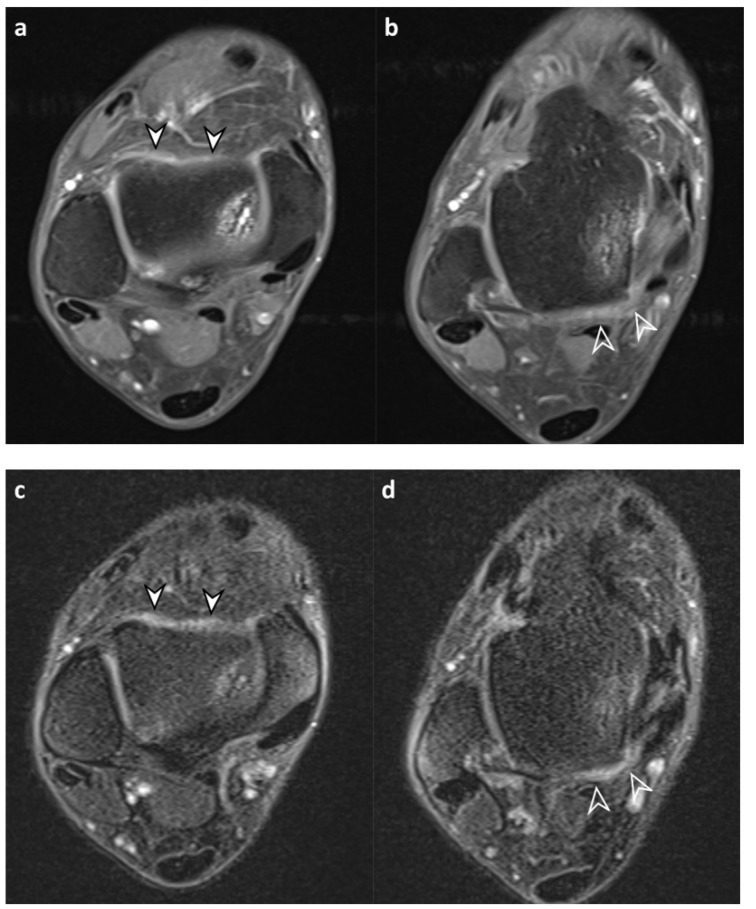
The purpose of this study was to investigate the feasibility of the fluid-attenuated inversion recovery sequence with fat suppression (FLAIR-FS) for the assessment of ankle synovitis without contrast enhancement. FLAIR-FS and contrast-enhanced, T1-weighted sequences (CE-T1) of 94 ankles were retrospectively reviewed by two radiologists. Grading of synovial visibility (four-point scale) and semi-quantitative scoring of synovial thickness (three-point scale) were performed in four compartments of the ankle in both sequences. Synovial visibility and thickness in FLAIR-FS and CE-T1 images were compared, and agreement between both sequences was assessed. Synovial visibility grades and synovial thickness scores for FLAIR-FS images were lower than those for CE-T1 images (reader 1, p = 0.016, p < 0.001; reader 2, p = 0.009, p < 0.001). Dichotomized synovial visibility grades (partial vs. full visibility) were not significantly different between both sequences. The agreement in synovial thickness scores between the FLAIR-FS and CE-T1 images was moderate to substantial (κ = 0.41-0.65). The interobserver agreement between the two readers was fair for synovial visibility (κ = 0.27-0.32) and moderate to substantial for synovial thickness (κ = 0.54-0.74). In conclusion, FLAIR-FS is a feasible MRI sequence for the evaluation of ankle synovitis without contrast enhancement.

Keywords: ankle synovitis; fluid-attenuated inversion recovery sequence; magnetic resonance imaging; synovitis imaging.


Conflict of interest statement

The authors declare no conflict of interest.

Figures

Figure 1
Figure 1
Flowchart shows the process used to enroll ankle MRIs.
Figure 2
Figure 2
Axial contrast-enhanced, T1-weighted images showing synovial enhancement. The ankle joint was divided into four compartments: anterior recess (A), anteromedial gutter (AM), anterolateral gutter (AL), and posterior recess (P). (a) The anterior recess (A) was defined as the central portion of the recess between the anterior tibial plafond and the talar dome. The posterior recess (P) was defined as the posteromedial recess formed anteriorly by the medial malleolus and posterior tibiotalar ligament, laterally by the talar dome and posterior process of the talus, and peripherally by the flexor hallucis longus tendon and neurovascular bundle. (b) The anteromedial gutter (AM) was the space formed superficially by the joint capsule, laterally by the talus, medially by the medial malleolus, and inferiorly by the anterior tibiotalar ligament. The anterolateral gutter (AL) was the space formed medially by the tibia, laterally by the fibula, superiorly by the anteroinferior tibiofibular ligament, inferiorly by the calcaneofibular ligament, and anteriorly by the anterior talofibular ligament and joint capsule. Both readers assigned a synovial visibility grade of 4 (fully visible synovium with good tissue contrast) in all joint compartments. Reader 1 assigned a synovial thickness score of 1 (maximum thickness 2–4 mm) in the anteromedial gutter and 2 (maximum thickness ≥4 mm) in the other compartments. Reader 2 assigned a synovial thickness score of 2 in all joint compartments.
Figure 3
Figure 3
A 48-year-old male with chronic lateral ankle instability. (a,b) Axial contrast-enhanced, T1-weighted sequence (CE-T1) with fat suppression images reveal enhanced synovium in the anterior recess (arrowheads), anteromedial gutter (curved arrow), anterolateral gutter (open arrowhead), and posterior recess (arrow). Both readers assigned a synovial visibility grade of 4 (fully visible synovium with good tissue contrast) in all joint compartments. For synovial thickness score, reader 1 assigned 1 (maximum thickness 2–4 mm), 1, 0 (maximum thickness < 2 mm), and 2 (maximum thickness ≥4 mm) and reader 2 assigned 1, 2, 0, and 1 in the anterior recess, anteromedial gutter, anterolateral gutter, and posterior recess, respectively. (c,d) Corresponding axial fluid-attenuated inversion recovery sequence with fat suppression (FLAIR-FS) images in the same level reveal synovium showing hyperintense signal intensity, similar to CE-T1 images. Both readers assigned a synovial visibility grade of 4 in all joint compartments. For synovial thickness score, reader 1 assigned 1, 1, 0, and 2 and reader 2 assigned 1, 1, 0, and 1 in the anterior recess, anteromedial gutter, anterolateral gutter, and posterior recess, respectively.
Figure 4
Figure 4
A 68-year-old male with osteoarthritis of the ankle joint. (a) Axial contrast-enhanced, T1-weighted sequence (CE-T1) with fat suppression image demonstrates enhanced synovium (arrowheads) with good tissue contrast. Both readers assigned a synovial visibility grade of 4 (fully visible synovium with good tissue contrast) in all joint compartments. For synovial thickness score, reader 1 assigned 2 (maximum thickness ≥ 4 mm), 1 (maximum thickness 2–4 mm), 1, and 2 and reader 2 assigned 2, 2, 2, and 2 in the anterior recess, anteromedial gutter, anterolateral gutter, and posterior recess, respectively. (b) Axial fluid-attenuated inversion recovery sequence with fat suppression (FLAIR-FS) image in the same level demonstrates dark signal intensity foci (arrows), suggesting suppressed joint fluid signals. Both readers assigned a synovial visibility grade of 4 in all joint compartments. For synovial thickness score, reader 1 assigned 2, 1, 0 (maximum thickness < 2 mm), and 1 and reader 2 assigned 1, 2, 0, and 1 in the anterior recess, anteromedial gutter, anterolateral gutter, and posterior recess, respectively. (c) Axial T2-weighted image in the same level shows joint fluid (arrows) at the location corresponding with dark signal intensity foci in FLAIR-FS image.
Figure 5
Figure 5
A 60-year-old male with osteochondral lesion of the talus. (a,b) Axial contrast-enhanced, T1-weighted sequence (CE-T1) with fat suppression images reveal enhanced synovium in the anterior recess (solid arrowheads) and posterior recess (open arrowheads). Both readers assigned a synovial visibility grade of 4 (fully visible synovium with good tissue contrast) in all joint compartments. Both readers assigned a synovial thickness score of 0 (maximum thickness < 2 mm) in all joint compartments. (c,d) Corresponding axial fluid-attenuated inversion recovery sequence with fat suppression (FLAIR-FS) images in the same level demonstrate hyperintense synovium at the location corresponding with CE-T1 images. Note that synovium appears thicker with better tissue contrast compared to CE-T1 images. Both readers assigned a synovial visibility grade of 4 (fully visible synovium with good tissue contrast) in all joint compartments. For synovial thickness score, reader 1 assigned 0, 0, 0, and 1 (maximum thickness 2–4 mm) and reader 2 assigned 1, 0, 0, and 1 in the anterior recess, anteromedial gutter, anterolateral gutter, and posterior recess, respectively.

Similar articles

Cited by

References

    1. Hayashi D., Roemer F.W., Katur A., Felson D.T., Yang S.-O., Alomran F., Guermazi A. Imaging of synovitis in osteoarthritis: Current status and outlook. Semin. Arthritis Rheum. 2011;41:116–130. doi: 10.1016/j.semarthrit.2010.12.003. - DOI - PubMed
    1. Burke C.J., Alizai H., Beltran L.S., Regatte R.R. MRI of synovitis and joint fluid. J. Magn. Reson. Imaging. 2019;49:1512–1527. doi: 10.1002/jmri.26618. - DOI - PMC - PubMed
    1. Prieto-Potin I., Largo R., Roman-Blas J.A., Herrero-Beaumont G., Walsh D. Characterization of multinucleated giant cells in synovium and subchondral bone in knee osteoarthritis and rheumatoid arthritis. BMC Musculoskelet. Disord. 2015;16:226. doi: 10.1186/s12891-015-0664-5. - DOI - PMC - PubMed
    1. Baker K., Grainger A., Niu J., Clancy M., Guermazi A., Crema M., Hughes L., Buckwalter J., Wooley A., Nevitt M., et al. Relation of synovitis to knee pain using contrast-enhanced MRIs. Ann. Rheum. Dis. 2010;69:1779–1783. doi: 10.1136/ard.2009.121426. - DOI - PMC - PubMed
    1. Guermazi A., Hayashi D., Roemer F.W., Zhu Y., Niu J., Crema M.D., Javaid M.K., Marra M.D., Lynch J.A., El-Khoury G.Y., et al. Synovitis in knee osteoarthritis assessed by contrast-enhanced magnetic resonance imaging (MRI) is associated with radiographic tibiofemoral osteoarthritis and MRI-detected widespread cartilage damage: The MOST study. J. Rheumatol. 2014;41:501–508. doi: 10.3899/jrheum.130541. - DOI - PMC - PubMed

LinkOut - more resources