. 2023 May 27;15(11):2949.
doi: 10.3390/cancers15112949.

Folic Acid Supplementation Promotes Hypomethylation in Both the Inflamed Colonic Mucosa and Colitis-Associated Dysplasia

Affiliations

Folic Acid Supplementation Promotes Hypomethylation in Both the Inflamed Colonic Mucosa and Colitis-Associated Dysplasia

Wen-Chi L Chang et al. Cancers (Basel). .

Abstract

Purpose: The purpose of this study was to assess the effect of folic acid (FA) supplementation on colitis-associated colorectal cancer (CRC) using the azoxymethane/dextran sulfate sodium (AOM/DSS) model.

Methods: Mice were fed a chow containing 2 mg/kg FA at baseline and randomized after the first DSS treatment to receive 0, 2, or 8 mg/kg FA chow for 16 weeks. Colon tissue was collected for histopathological evaluation, genome-wide methylation analyses (Digital Restriction Enzyme Assay of Methylation), and gene expression profiling (RNA-Seq).

Results: A dose-dependent increase in the multiplicity of colonic dysplasias was observed, with the multiplicity of total and polypoid dysplasias higher (64% and 225%, respectively) in the 8 mg FA vs. the 0 mg FA group (p < 0.001). Polypoid dysplasias were hypomethylated, as compared to the non-neoplastic colonic mucosa (p < 0.05), irrespective of FA treatment. The colonic mucosa of the 8 mg FA group was markedly hypomethylated as compared to the 0 mg FA group. Differential methylation of genes involved in Wnt/β-catenin and MAPK signaling resulted in corresponding alterations in gene expression within the colonic mucosa.

Conclusions: High-dose FA created an altered epigenetic field effect within the non-neoplastic colonic mucosa. The observed decrease in site-specific DNA methylation altered oncogenic pathways and promoted colitis-associated CRC.

Keywords: colitis; colon; folic acid; methylation; tumorigenesis.


Conflict of interest statement

The authors declare no conflict of interest.

Figures

Figure 1
Figure 1
Experimental design of the study. Mice were injected with azoxymethane (AOM, 7.4 mg/kg i.p.) at 7 weeks of age. Colitis was induced with DSS, starting at 9 weeks of age. Mice were randomly assigned to receive different amounts of folic acid (FA) in an AIN-76A diet at 11 weeks of age and euthanized at 27 weeks of age (17–19/group).
Figure 2
Figure 2
Low power view of non-neoplastic colon and dysplasias in the AOM/DSS model.
Figure 3
Figure 3
Weekly body weights of Swiss Webster mice with AOM/DSS-induced colitis. Mice were maintained on an AIN-76A diet supplemented with an either 0, 2, or 8 mg FA/kg diet (17–19/group).
Figure 4
Figure 4
Effects of various doses of FA on the multiplicity of colitis-associated dysplasia. The total number of dysplasias is the sum of polypoid and flat dysplasias. Poisson regression with log link was used to determine the association between FA dose and tumor multiplicity (n = 17–19/group).
Figure 5
Figure 5
Volcano plots of DNA methylation profiles for LMD non-dysplastic colonic epithelium from AOM/DSS-treated mice receiving varying amounts of FA. Repeat sequences were compared in the (A) 8 mg FA- vs. 0 mg FA-treated epithelium (8ND vs. 0ND) and (B) 2 mg FA- vs. 0 mg FA-treated epithelium (2ND vs. 0ND). Unique sequences were compared in the (C) 8 mg FA- vs. 0 mg FA-treated epithelium (8ND vs. 0ND) and (D) 2 mg FA- vs. 0 mg FA-treated epithelium (2ND vs. 0ND). The t-test was used to compare site-specific DNA methylation levels between FA treatment groups (n = 8 per group). Sites with p values less than 0.05 (*) and more than a 5% methylation difference were considered significantly different between groups. δ = significant hypermethylated CpGs expressed as a percentage of the total sum of significant CpGs; ε = significant hypomethylated CpGs expressed as a percentage of the total sum of significant CpGs; ⊕ = sum of significant CpGs (hypomethylated and hypermethylated) expressed as a percentage of total CpGs.
Figure 6
Figure 6
Volcano plots of DNA methylation profiles for LMD non-dysplastic colonic epithelium plus the lamina propria from AOM/DSS-treated mice receiving varying amounts of FA. (A) Repeat and (B) unique sequences of non-dysplastic colonic epithelium plus the lamina propria from mice in the 8 mg vs. 0 mg FA group (8ND vs. 0ND) were compared. The t-test was used to identify significant alterations in site-specific DNA methylation levels between FA treatment groups (n = 12 per group). Sites with p values less than 0.05 (*) and more than a 5% methylation difference were considered significantly different. δ = significant hypermethylated CpGs expressed as a percentage of the total sum of significant CpGs; ε = significant hypomethylated CpGs expressed as a percentage of the total sum of significant CpGs; ⊕ = sum of significant CpGs (hypomethylated and hypermethylated) expressed as a percentage of total CpGs.
Figure 7
Figure 7
Volcano plots of DNA methylation profiles for LMD non-dysplastic colonic epithelium from AOM-treated (non-colitis) mice receiving varying amounts of FA. (A) Repeat and (B) unique sequences of non-dysplastic and non-inflamed colonic epithelium from the 8 mg vs. 0 mg FA group (8ND vs. 0ND) were compared. The t-test was used to identify significant alterations in site-specific DNA methylation levels between FA treatment groups (n = 7–8 per group). Sites with p values less than 0.05 (*) and more than a 5% methylation difference were considered significantly different. δ = significant hypermethylated CpGs expressed as a percentage of the total sum of significant CpGs; ε = significant hypomethylated CpGs expressed as a percentage of the total sum of significant CpGs; ⊕ = sum of significant CpGs (hypomethylated and hypermethylated) expressed as a percentage of total CpGs.
Figure 8
Figure 8
Volcano plots of DNA methylation profiles for polypoid dysplasia from AOM/DSS-treated mice receiving 0 or 8 mg of FA. (A) Repeat sequences: 8 mg FA-treated polypoid dysplasia vs. non-dysplastic epithelium (8P vs. 8ND); (B) repeat sequences: 0 mg FA-treated polypoid dysplasia vs. non-dysplastic epithelium (0P vs. 0ND); (C) unique sequences: 8 mg FA-treated polypoid dysplasia vs. non-dysplastic epithelium (8P vs. 8ND); (D) unique sequences: 0 mg FA-treated polypoid dysplasia vs. non-dysplastic epithelium (0P vs. 0ND); (E) repeat sequences: 8 mg FA vs. 0 mg FA-treated polypoid dysplasia (8P vs. 0P); and (F) unique sequences: 8 mg FA vs. 0 mg FA-treated polypoid dysplasia (8P vs. 0P). The t-test was used to compare site-specific DNA methylation levels between FA treatment groups (n = 12 per group for non-dysplastic epithelium and n = 8 per group for polypoid dysplasia). Sites with p values less than 0.05 (*) and more than a 5% methylation difference were considered significantly different between groups. δ = significant hypermethylated CpGs expressed as a percentage of the total sum of significant CpGs; ε = significant hypomethylated CpGs expressed as a percentage of the total sum of significant CpGs; ⊕ = sum of significant CpGs (hypomethylated and hypermethylated) expressed as a percentage of total CpGs.
Figure 9
Figure 9
DNA methylation status is impacted by an interaction between FA dose and colon tissue type. Volcano plots summarizing the methylation profiles of (A) repeat and (B) unique sequences in 0 mg FA-treated polypoid dysplasia vs. 8 mg FA-treated non-dysplastic epithelium (0P vs. 8ND), and (C) repeat and (D) unique sequences in 8 mg FA-treated polypoid dysplasia vs. 0 mg FA-treated non-dysplastic epithelium (8P vs. 0ND). The t-test was used to compare site-specific DNA methylation levels between FA treatment groups (n = 12 per group for non-dysplastic epithelium and n = 8 per group for polypoid dysplasia). Sites with p values less than 0.05 (*) and more than a 5% methylation difference were considered significantly different between groups. δ = significant hypermethylated CpGs expressed as a percentage of the total sum of significant CpGs; ε = significant hypomethylated CpGs expressed as a percentage of the total sum of significant CpGs; ⊕ = sum of significant CpGs (hypomethylated and hypermethylated) expressed as a percentage of total CpGs.
Figure 10
Figure 10
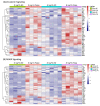
Heatmaps of the expression level of genes in the β-catenin and MAPK pathways. Mice with AOM/DSS-induced colitis were administered 0 mg or 8 mg FA. Epithelial cells from the non-neoplastic colonic mucosa or polypoid lesions were LMD and analyzed by RNA-Seq. The expression of genes associated with (A) β-catenin and (B) MAPK signaling were profiled for several treatment groups: 0 mg FA-treated non-dysplastic epithelium (0 mg FA ND), 0 mg FA-treated polypoid (0 mg FA Polyp), 8 mg FA-treated non-dysplastic epithelium (8 mg FA ND), and 8 mg FA-treated polypoid (8 mg FA Polyp).
Figure 11
Figure 11
Immunohistochemical staining of β-catenin in the murine colon. Representative images (200×) show (A) membrane staining of β-catenin in the non-dysplastic colon and (B,C) overexpression and nuclear localization of β-catenin in polypoid lesions. Unlike polypoid lesions from mice treated with FA 0 mg, the majority of tumor cells in polypoid lesions from mice treated with FA 8 mg exhibited overexpression or nuclear localization of β-catenin.
Figure 12
Figure 12
Effects of FA on the expression of inflammatory mediators. The expression level of inflammatory genes was evaluated using LMD non-dysplastic colonic mucosa (ND) from AOM/DSS-treated mice fed 0, 2, or 8 mg FA. Results are expressed as the fold-change in relative levels of each gene transcript for mice receiving varying levels of FA. Statistical analyses were performed using the t-test. n = 8 per group.
Figure 13
Figure 13
Proposed mechanism by which FA alters DNA methylation and promotes colitis-associated tumorigenesis.

Similar articles

Cited by

References

    1. Rutter M.D., Saunders B.P., Wilkinson K.H., Rumbles S., Schofield G., Kamm M.A., Williams C.B., Price A.B., Talbot I.C., Forbes A. Thirty-year analysis of a colonoscopic surveillance program for neoplasia in ulcerative colitis. Gastroenterology. 2006;130:1030–1038. doi: 10.1053/j.gastro.2005.12.035. - DOI - PubMed
    1. Hardy R.G., Meltzer S.J., Jankowski J.A. ABC of colorectal cancer. Molecular basis for risk factors. BMJ. 2000;321:886–889. doi: 10.1136/bmj.321.7265.886. - DOI - PMC - PubMed
    1. Hartnett L., Egan L.J. Inflammation, DNA methylation and colitis-associated cancer. Carcinogenesis. 2012;33:723–731. doi: 10.1093/carcin/bgs006. - DOI - PubMed
    1. Akbulut S., Altiparmak E., Topal F., Ozaslan E., Kucukazman M., Yonem O. Increased levels of homocysteine in patients with ulcerative colitis. World J. Gastroenterol. 2010;16:2411–2416. doi: 10.3748/wjg.v16.i19.2411. - DOI - PMC - PubMed
    1. Yakut M., Ustun Y., Kabacam G., Soykan I. Serum vitamin B12 and folate status in patients with inflammatory bowel diseases. Eur. J. Intern. Med. 2010;21:320–323. doi: 10.1016/j.ejim.2010.05.007. - DOI - PubMed