Review
. 2023 May 30;15(11):2992.
doi: 10.3390/cancers15112992.

Conventional and Advanced Magnetic Resonance Imaging Assessment of Non-Enhancing Peritumoral Area in Brain Tumor

Affiliations
Review

Conventional and Advanced Magnetic Resonance Imaging Assessment of Non-Enhancing Peritumoral Area in Brain Tumor

Elisa Scola et al. Cancers (Basel). .

Abstract

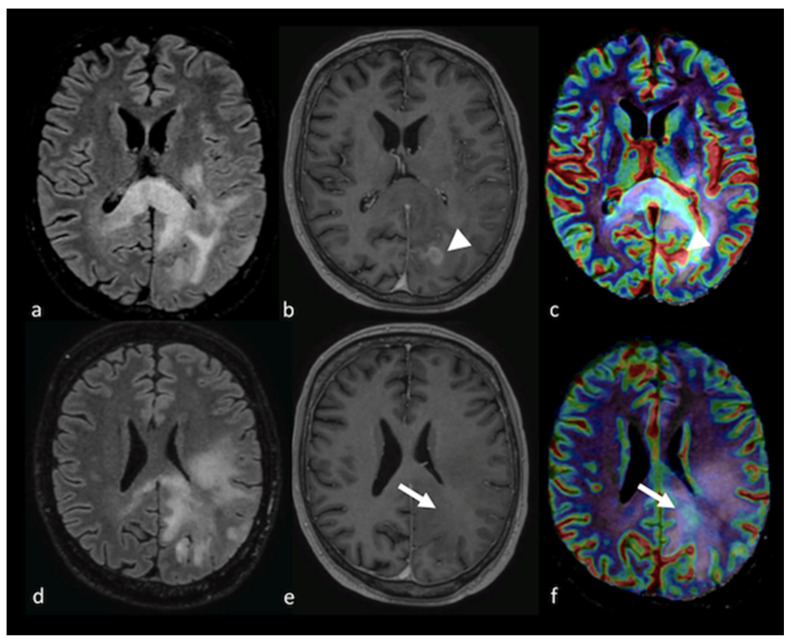
The non-enhancing peritumoral area (NEPA) is defined as the hyperintense region in T2-weighted and fluid-attenuated inversion recovery (FLAIR) images surrounding a brain tumor. The NEPA corresponds to different pathological processes, including vasogenic edema and infiltrative edema. The analysis of the NEPA with conventional and advanced magnetic resonance imaging (MRI) was proposed in the differential diagnosis of solid brain tumors, showing higher accuracy than MRI evaluation of the enhancing part of the tumor. In particular, MRI assessment of the NEPA was demonstrated to be a promising tool for distinguishing high-grade gliomas from primary lymphoma and brain metastases. Additionally, the MRI characteristics of the NEPA were found to correlate with prognosis and treatment response. The purpose of this narrative review was to describe MRI features of the NEPA obtained with conventional and advanced MRI techniques to better understand their potential in identifying the different characteristics of high-grade gliomas, primary lymphoma and brain metastases and in predicting clinical outcome and response to surgery and chemo-irradiation. Diffusion and perfusion techniques, such as diffusion tensor imaging (DTI), diffusional kurtosis imaging (DKI), dynamic susceptibility contrast-enhanced (DSC) perfusion imaging, dynamic contrast-enhanced (DCE) perfusion imaging, arterial spin labeling (ASL), spectroscopy and amide proton transfer (APT), were the advanced MRI procedures we reviewed.

Keywords: MRI; advanced techniques; brain tumors; neuroradiology; peritumoral edema.


Conflict of interest statement

The authors declare no conflict of interest.

Figures

Figure 1
Figure 1
Cortical involvement in BMs and HGGs: (a,c) axial T2 GE-weighted image; (b,d) axial FLAIR T2-weighted image showing, respectively, a left frontal BM without T2 hyperintensity gyral involvement ((a,b) white arrows) and a parietal HGG with T2 hyperintensity cortical involvement ((c,d) arrowheads). BM: brain metastasis; HGG: high-grade glioma.
Figure 2
Figure 2
DWI and PWI in left frontal PCNSL: (a) axial T2-weighted image; (b) axial postcontrast T1-weighted image; (c) CBV map from DSC imaging study; and (d) ADC map from DWI study showing a left frontal lesion with intense enhancement and a large NEPA with low ADC and a mild increase in CBV within the contrast-enhanced lesion (white arrows) corresponding to elevated cellularity, high ADC values and hypoperfusion in the NEPA (white arrowheads), suggesting vasogenic edema. PWI: perfusion-weighted imaging; DWI: diffusion-weighted imaging; PCNSL: primary central nervous system lymphoma; CBV: cerebral blood volume; DSC: dynamic susceptibility contrast-enhanced; ADC: apparent diffusion coefficient; NEPA: non-enhancing peritumoral area.
Figure 3
Figure 3
DWI of right parietal HGG: (a,e) axial T2-weighted image (b,c,f,g); axial postcontrast T1-weighted image; and (d,h) ADC map from DWI study showing a right parietal lesion with peripheral (ring) enhancement and NEPA with low ADC (white arrows) outside the contrast-enhanced lesion’s border (arrowhead), suggesting an infiltrative pattern for the HGG. DWI: diffusion-weighted imaging; HGG: high-grade glioma; ADC: apparent diffusion coefficient; NEPA: non-enhancing peritumoral area.
Figure 4
Figure 4
Diffusion imaging in left parietal metastasis: (a,e) axial GE T2-weighted image; (b,f) axial postcontrast T1-weighted image; (c,g) ADC map from DWI study; (d,h) DTI image displaying a lesion in the left parietal lobe characterized by heterogeneous contrast enhancement and the presence of blood products and showing an extensive NEPA. The NEPA is characterized by high ADC values (white arrow) due to vasogenic edema. The DTI FA color map shows a decrease in FA values due to the increase in extracellular fluid, which reduces the directionality of diffusion, leading to a reduction in the visualization of the white matter fibers (arrowhead). GE: gradient echo; ADC: apparent diffusion coefficient; DWI: diffusion-weighted imaging; DTI: diffusion tensor imaging; NEPA: non-enhancing peritumoral area; FA: fractional anisotropy.
Figure 5
Figure 5
Diffusion imaging in left temporo-insular HGG: (a) axial FLAIR T2-weighted image; (b) ADC map from DWI study; (c) isotropic DWI images; (d) axial postcontrast T1-weighted image; (e) DTI FA color map; and (f) FA map from DTI study showing a left parieto-insular lesion with low ADC that extends over the contrast-enhanced rim (white arrow). The DTI study shows a decrease in FA values in the NEPA due to tumoral infiltration of white matter fibers (arrowhead). HGG: high-grade glioma; ADC: apparent diffusion coefficient; DWI: diffusion-weighted imaging; DTI: diffusion tensor imaging; FA: fractional anisotropy; NEPA: non-enhancing peritumoral area.
Figure 6
Figure 6
PWI in left parieto-occipital HGG: (a,d) axial T2 FLAIR image; (b,e) axial postcontrast T1-weighted image; and (c,f) CBV map from DSC imaging study showing an extensive T2 FLAIR hyperintense region affecting the left parietal and occipital lobe with the involvement of the corpus callosum and a ring enhancement component (arrowhead). The CBV map shows a mild increase in not only the contrast-enhanced area (arrowhead) but also in the NEPA (white arrow), suggesting an infiltrative pattern. PWI: perfusion-weighted imaging; HGG: high-grade glioma; CBV: cerebral blood volume; DSC: dynamic susceptibility contrast-enhanced; NEPA: non-enhancing peritumoral area.
Figure 7
Figure 7
PWI imaging in left parietal metastasis: (a,d) axial postcontrast T1-weighted image; (b,e) axial GE T2-weighted image; and (c,f) CBV map from DSC imaging study showing a left parietal lesion with heterogeneous contrast enhancement and the presence of blood products with an extensive NEPA characterized by a very low CBV value (white arrow). This case is also shown in Figure 4. GE: gradient echo; CBV: cerebral blood volume; DSC: dynamic susceptibility contrast-enhanced; NEPA: non-enhancing peritumoral area.
Figure 8
Figure 8
PWI in right parietal HGG: (a,d) axial T2-weighted image; (b,e) axial postcontrast T-1 weighted image; (c) Vp map from DCE study; (f) CBV map from DSC perfusion study. Right parietal lesion with irregular enhancement, cystic component and large NEPA. In the Vp map (c), ROI 1 positioned in the NEPA (arrowhead) shows a higher value compared to ROI 2 positioned in the contralateral normal-appearing white matter (ROI 1 Vp = 4.412 × 10⁻³; ROI 2 Vp = 0.276 × 10⁻³). The CBV map (f) shows an increase in the CBV value (white arrow) in the NEPA compared to the contrast-enhanced area, suggesting an infiltrative pattern. This case is also shown in Figure 3. PWI: perfusion-weighted imaging; HGG: high-grade glioma; Vp: volume of plasma; DCE: dynamic contrast-enhanced; CBV: cerebral blood volume; DSC: dynamic susceptibility contrast-enhanced; NEPA: non-enhancing peritumoral area; ROI: region of interest.
Figure 9
Figure 9
DWI and ASL in a left occipital BM: (a) axial T2 GE-weighted image; (b) axial postcontrast T1-weighted image; (c) ADC map from DWI study; and (d) CBF map from ASL study showing a left occipital BM with enhancement and large NEPA, with high CBF in the contrast-enhanced lesion (white arrows) and high ADC and low CBF within the NEPA (white arrowheads), suggesting vasogenic edema. DWI: diffusion-weighted imaging; ASL: arterial spin labeling; BM: brain metastasis; GE: gradient echo; ADC: apparent diffusion coefficient; CBF: cerebral blood flow; NEPA: non-enhancing peritumoral area.
Figure 10
Figure 10
MRS study of left parietal HGG: (a) axial T2−weighted image; (b) axial T2 FLAIR image; (c) axial postcontrast T1−weighted image; (d) CBV map from DSC imaging study; and (e) MRS single−voxel study with 144 ms echo time showing an increase in the choline peak (white arrow) in the NEPA even in the absence of a CBV increase, suggesting an infiltrative pattern in the NEPA. The red box is the VOI used for MRS study. MRS: magnetic resonance spectroscopy; HGG: high-grade glioma; CBV: cerebral blood volume; DSC: dynamic susceptibility contrast-enhanced; NEPA: non-enhancing peritumoral area; VOI: Volume of Interest.
Figure 11
Figure 11
MRS study of left frontal hemorrhagic BM: (a) axial T2 GE−weighted image; (b) axial T2 FLAIR image; (c) axial postcontrast T1−weighted image; (d) MRS single−voxel study with 144 ms echo time showing a normal choline peak (white arrow) in the NEPA, suggesting a vasogenic pattern in the NEPA. The red box is the VOI used for MRS study. This case is shown also in Figure 1. MRS: magnetic resonance spectroscopy; BM: brain metastasis; GE: gradient echo; NEPA: non-enhancing peritumoral area; VOI: Volume Of Interest.
Figure 12
Figure 12
APT in right parietal HGGs: (a,e) axial T2-weighted image; (b,f) axial postcontrast T1-weighted image; (c,g) color APT map; (d,h) APT map. Right parietal lesion with irregular enhancement, cystic component and associated NEPA. In the APT maps (c,d,g,h), the enhanced area shows increased APT (arrow); (c,d) increased APT values were also demonstrated in the NEPA (arrowhead), suggesting an infiltrative pattern, as confirmed by increased APT values measured in ROI 1 in NEPA (1.71%) compared to ROI 2 (0.65%) in left normal appearing white matter (h, white circles). This case is also shown in Figure 3. APT: amide proton transfer; HGG: high-grade glioma; NEPA: non-enhancing peritumoral area; ROI: Region Of Interest.

References

    1. Langen K.J., Galldiks N., Hattingen E., Shah N.J. Advances in neuro-oncology imaging. Nat. Rev. Neurol. 2017;13:279–289. doi: 10.1038/nrneurol.2017.44. - DOI - PubMed
    1. Chiavazza C., Pellerino A., Ferrio F., Cistaro A., Soffietti R., Ruda R. Primary CNS Lymphomas: Challenges in Diagnosis and Monitoring. BioMed Res. Int. 2018;2018:3606970. doi: 10.1155/2018/3606970. - DOI - PMC - PubMed
    1. Lin X., Lee M., Buck O., Woo K.M., Zhang Z., Hatzoglou V., Omuro A., Arevalo-Perez J., Thomas A.A., Huse J., et al. Diagnostic Accuracy of T1-Weighted Dynamic Contrast-Enhanced-MRI and DWI-ADC for Differentiation of Glioblastoma and Primary CNS Lymphoma. AJNR Am. J. Neuroradiol. 2017;38:485–491. doi: 10.3174/ajnr.A5023. - DOI - PMC - PubMed
    1. Lemee J.M., Clavreul A., Aubry M., Com E., de Tayrac M., Eliat P.A., Henry C., Rousseau A., Mosser J., Menei P. Characterizing the peritumoral brain zone in glioblastoma: A multidisciplinary analysis. J. Neurooncol. 2015;122:53–61. doi: 10.1007/s11060-014-1695-8. - DOI - PubMed
    1. Villanueva-Meyer J.E., Mabray M.C., Cha S. Current Clinical Brain Tumor Imaging. Neurosurgery. 2017;81:397–415. doi: 10.1093/neuros/nyx103. - DOI - PMC - PubMed

LinkOut - more resources