

Clustering Analysis Identified Three Long COVID Phenotypes and Their Association with General Health Status and Working Ability
- PMID: 37297812
- PMCID: PMC10253616
- DOI: 10.3390/jcm12113617
Clustering Analysis Identified Three Long COVID Phenotypes and Their Association with General Health Status and Working Ability
Abstract
Background/aim: This study aimed to distinguish different phenotypes of long COVID through the post-COVID syndrome (PCS) score based on long-term persistent symptoms following COVID-19 and evaluate whether these symptoms affect general health and work ability. In addition, the study identified predictors for severe long COVID.
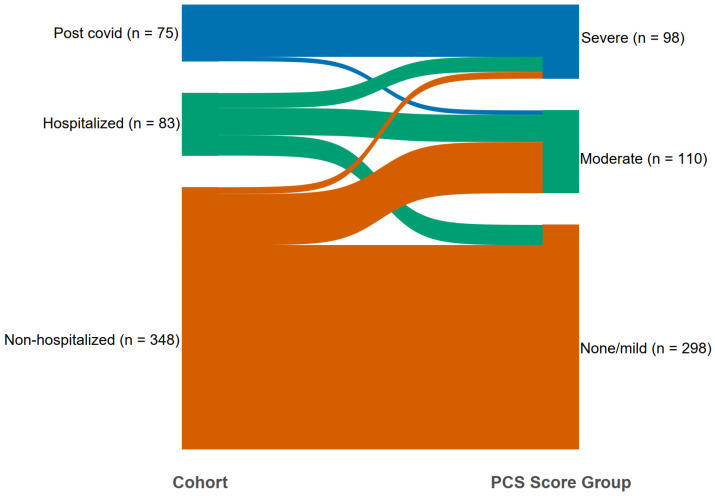
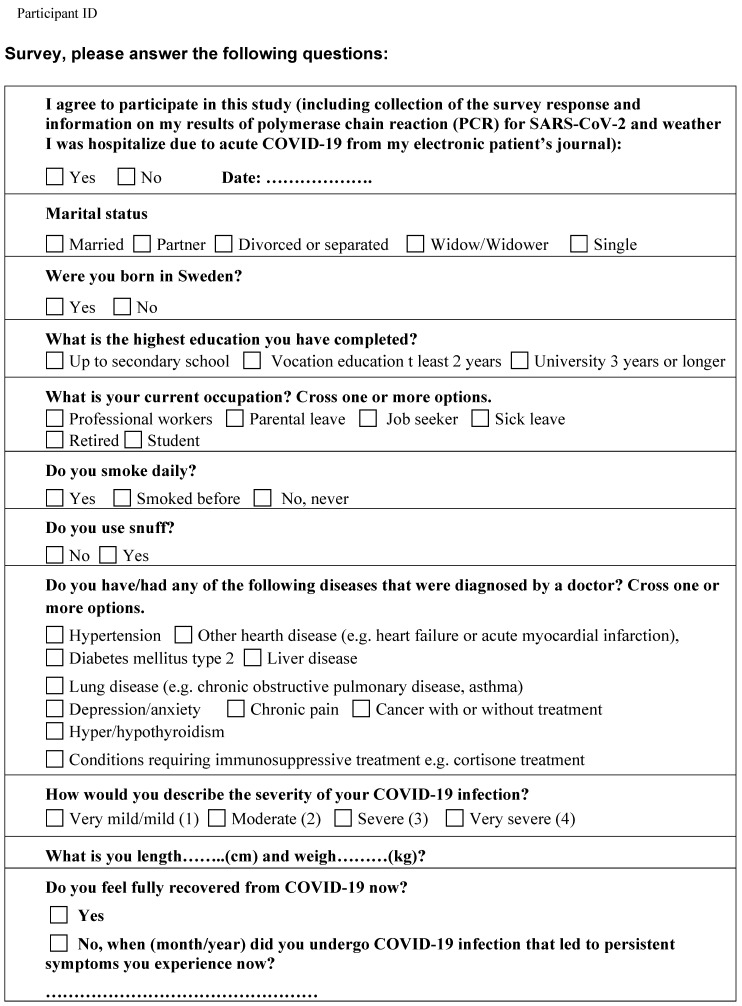
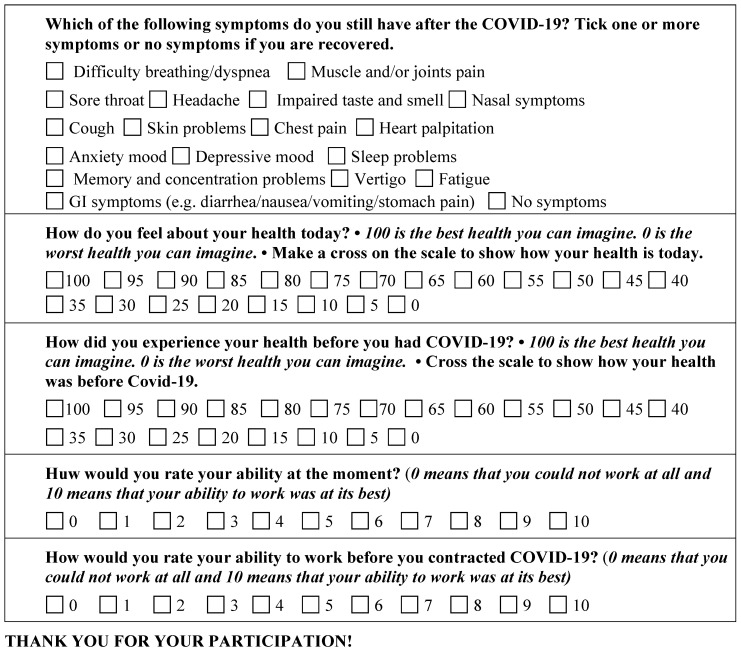
Method: This cluster analysis included cross-sectional data from three cohorts of patients after COVID-19: non-hospitalized (n = 401), hospitalized (n = 98) and those enrolled at the post-COVID outpatient's clinic (n = 85). All the subjects responded to the survey on persistent long-term symptoms and sociodemographic and clinical factors. K-Means cluster analysis and ordinal logistic regression were used to create PCS scores that were used to distinguish patients' phenotypes.
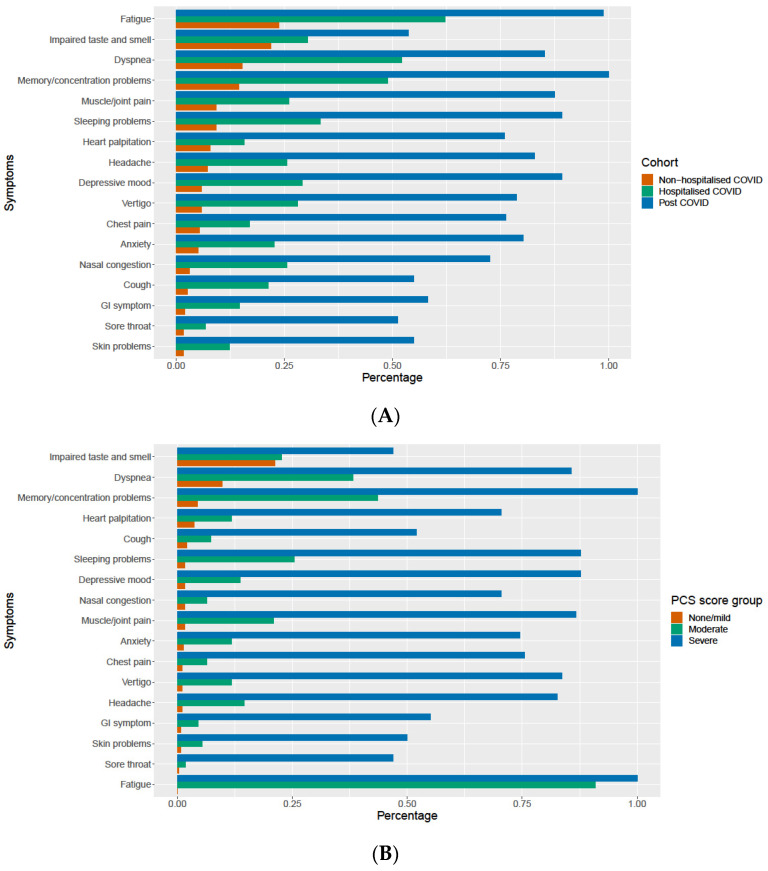
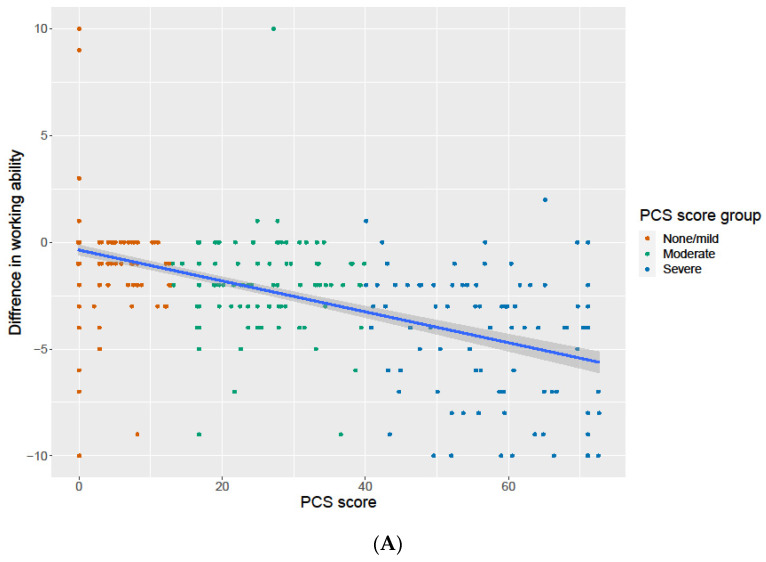
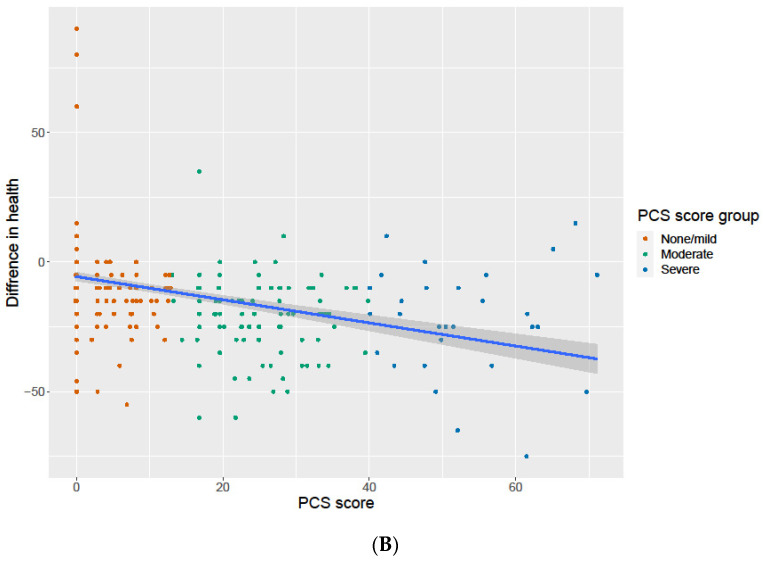
Results: 506 patients with complete data on persistent symptoms were divided into three distinct phenotypes: none/mild (59%), moderate (22%) and severe (19%). The patients with severe phenotype, with the predominating symptoms were fatigue, cognitive impairment and depression, had the most reduced general health status and work ability. Smoking, snuff, body mass index (BMI), diabetes, chronic pain and symptom severity at COVID-19 onset were factors predicting severe phenotype.
Conclusion: This study suggested three phenotypes of long COVID, where the most severe was associated with the highest impact on general health status and working ability. This knowledge on long COVID phenotypes could be used by clinicians to support their medical decisions regarding prioritizing and more detailed follow-up of some patient groups.
Keywords: COVID-19; general health status; long COVID phenotypes; persistent long-term symptoms; working ability.
Conflict of interest statement
All authors declare no conflict of interest. The funders had no role in the design of the study; in the collection, analyses, or interpretation of data; in the writing of the manuscript; or in the decision to publish the results.
Figures

Similar articles
-
Unveiling Post-COVID-19 syndrome: incidence, biomarkers, and clinical phenotypes in a Thai population.BMC Infect Dis. 2024 Oct 10;24(1):1132. doi: 10.1186/s12879-024-10055-2. BMC Infect Dis. 2024. PMID: 39385068 Free PMC article.
-
Clinical phenotypes and quality of life to define post-COVID-19 syndrome: a cluster analysis of the multinational, prospective ORCHESTRA cohort.EClinicalMedicine. 2023 Jul 21;62:102107. doi: 10.1016/j.eclinm.2023.102107. eCollection 2023 Aug. EClinicalMedicine. 2023. PMID: 37654668 Free PMC article.
-
Predictors of post-COVID-19 and the impact of persistent symptoms in non-hospitalized patients 12 months after COVID-19, with a focus on work ability.Ups J Med Sci. 2022 Aug 9;127. doi: 10.48101/ujms.v127.8794. eCollection 2022. Ups J Med Sci. 2022. PMID: 35991464 Free PMC article.
-
Behavioural modification interventions for medically unexplained symptoms in primary care: systematic reviews and economic evaluation.Health Technol Assess. 2020 Sep;24(46):1-490. doi: 10.3310/hta24460. Health Technol Assess. 2020. PMID: 32975190 Free PMC article.
-
Post-acute COVID-19 syndrome (PCS) and health-related quality of life (HRQoL)-A systematic review and meta-analysis.J Med Virol. 2022 Jan;94(1):253-262. doi: 10.1002/jmv.27309. Epub 2021 Sep 7. J Med Virol. 2022. PMID: 34463956 Free PMC article.
Cited by
-
Enhancing EQ-5D-5L Sensitivity in Capturing the Most Common Symptoms in Post-COVID-19 Patients: An Exploratory Cross-Sectional Study with a Focus on Fatigue, Memory/Concentration Problems and Dyspnea Dimensions.Int J Environ Res Public Health. 2024 May 3;21(5):591. doi: 10.3390/ijerph21050591. Int J Environ Res Public Health. 2024. PMID: 38791805 Free PMC article.
-
Long COVID Clusters of Symptoms Persist beyond Two Years after Infection: Insights from the CARDIO COVID 20-21 Registry.Viruses. 2024 Jun 26;16(7):1028. doi: 10.3390/v16071028. Viruses. 2024. PMID: 39066191 Free PMC article.
-
Long COVID and its risk factors in migrants: a nationwide register study from Sweden.BMC Med. 2025 Jan 29;23(1):53. doi: 10.1186/s12916-025-03900-x. BMC Med. 2025. PMID: 39875996 Free PMC article.
-
Long COVID's Hidden Complexity: Machine Learning Reveals Why Personalized Care Remains Essential.J Clin Med. 2025 May 23;14(11):3670. doi: 10.3390/jcm14113670. J Clin Med. 2025. PMID: 40507431 Free PMC article.
-
Unveiling Post-COVID-19 syndrome: incidence, biomarkers, and clinical phenotypes in a Thai population.BMC Infect Dis. 2024 Oct 10;24(1):1132. doi: 10.1186/s12879-024-10055-2. BMC Infect Dis. 2024. PMID: 39385068 Free PMC article.
References
-
- Thompson E.J., Williams D.M., Walker A.J., Mitchell R.E., Niedzwiedz C.L., Yang T.C., Huggins C.F., Kwong A.S.F., Silverwood R.J., Di Gessa G., et al. Long COVID burden and risk factors in 10 UK longitudinal studies and electronic health records. Nat. Commun. 2022;13:3528. doi: 10.1038/s41467-022-30836-0. - DOI - PMC - PubMed
-
- World Health Organization Post COVID-19 Condition. 2022. [(accessed on 10 May 2023)]. Available online: https://www.who.int/europe/news-room/fact-sheets/item/post-covid-19-cond....
-
- Evans R.A., McAuley H., Harrison E.M., Shikotra A., Singapuri A., Sereno M., Elneima O., Docherty A.B., Lone N.I., Leavy O.C., et al. Physical, cognitive, and mental health impacts of COVID-19 after hospitalisation (PHOSP-COVID): A UK multicentre, prospective cohort study. Lancet Respir. Med. 2021;9:1275–1287. doi: 10.1016/S2213-2600(21)00383-0. - DOI - PMC - PubMed
Grants and funding
LinkOut - more resources
Full Text Sources
