Review
. 2023 May 23;12(11):3626.
doi: 10.3390/jcm12113626.

Dual Source Photon-Counting Computed Tomography-Part II: Clinical Overview of Neurovascular Applications

Affiliations
Review

Dual Source Photon-Counting Computed Tomography-Part II: Clinical Overview of Neurovascular Applications

Filippo Cademartiri et al. J Clin Med. .

Abstract

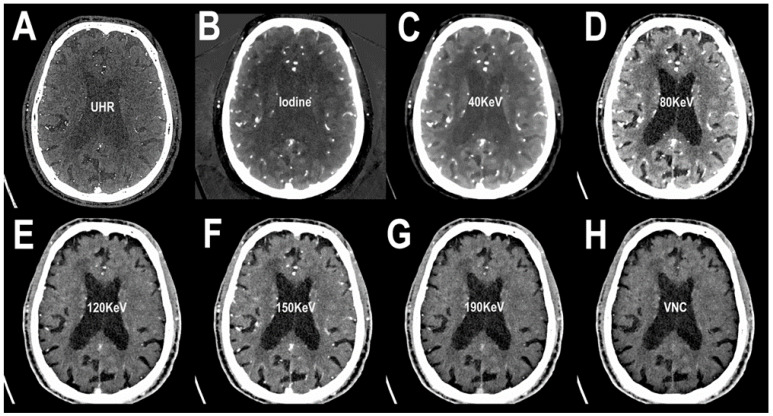
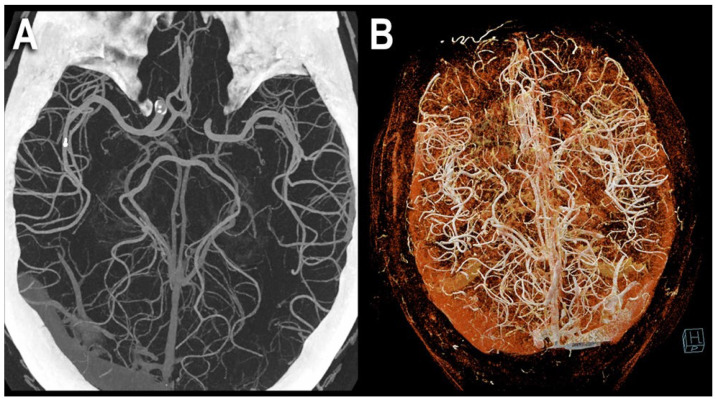
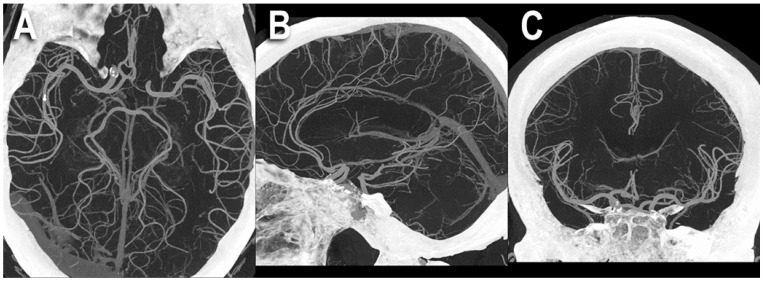
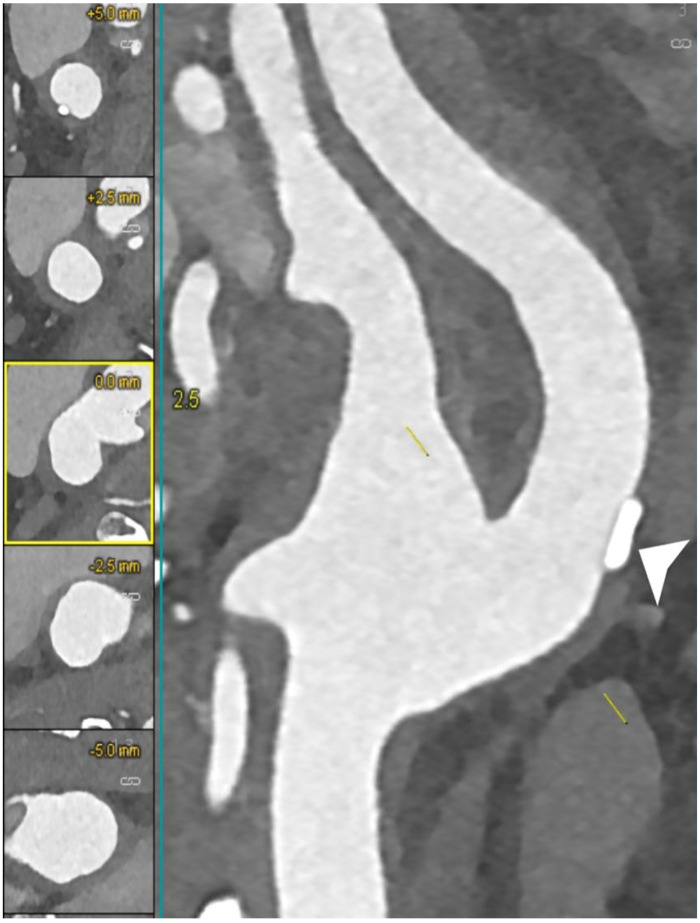
Photon-counting detector (PCD) is a novel computed tomography detector technology (photon-counting computed tomography-PCCT) that presents many advantages in the neurovascular field, such as increased spatial resolution, reduced radiation exposure, and optimization of the use of contrast agents and material decomposition. In this overview of the existing literature on PCCT, we describe the physical principles, the advantages and the disadvantages of conventional energy integrating detectors and PCDs, and finally, we discuss the applications of the PCD, focusing specifically on its implementation in the neurovascular field.

Keywords: computed tomography angiography; energy integrating detector; neurovascular; photon-counting computed tomography; photon-counting detector.


Conflict of interest statement

The authors declare no conflict of interest.

Figures

Figure 1
Figure 1
PCCT angiography of the head: monochromatic imaging. The figure shows an axial slice image from a brain scan performed in the arterial phase after intravenous contrast material administration. In (A), the ultra-high resolution (matrix 1024 × 1024; slice thickness/increment 0.2/0.1 mm; voxel 100 microns; convolution kernel B60f; radiation dose comparable to equivalent CT angiography of the head with comparable Dual-source CT of the 3rd generation) is visualized. Since the acquired images are enriched with the entire KeV spectrum, in (B), the same slice with an iodine spectrum is visible. From (CG), the same slice is showed in different KeV settings, starting from 40 KeV up to 190 KeV. While the image can be reconstructed with the iodine spectrum as in (B), it is also possible to reconstruct and subtract the iodine spectrum (i.e., the contrast enhancement determined by iodinated contrast material) creating a virtual noncontrast image (VNC) (H). From a single PCCT acquisition, it is possible to derive several multiparametric information.
Figure 2
Figure 2
PCCT angiography of the head: 3D cinematic volume rendering display. The figure shows a PCCT angiography of the brain with ultra-high resolution of 100 microns (source dataset; matrix 1024 × 1024; slice thickness/increment 0.2/0.1 mm; convolution kernel B60f; radiation dose comparable to equivalent CT angiography of the head with comparable Dual-source CT of the 3rd generation) using volumetric 3D Maximum Intensity Projection (MIP) (A) and cinematic volume rendering (B). To be noted is the massive increase in the density of the small arterial vessels displayed.
Figure 3
Figure 3
PCCT angiography of the head: MIP volumetric display. The figure shows a PCCT angiography of the brain with ultra-high resolution of 100 microns (source dataset; matrix 1024 × 1024; slice thickness/increment 0.2/0.1 mm; convolution kernel B60f; radiation dose comparable to equivalent CT angiography of the head with comparable Dual-source CT of the 3rd generation) using thick-slab 3D Maximum Intensity Projection (MIP) in the three main planes: axial (A), sagittal (B), and coronal (C). To be noted is the massive increase in the density of the small arterial vessels displayed and the length of the segments visualized; for arteria cerebralis posterior and media in (A), for arteria cerebralis anterior in (B), and for arteria cerebralis media in (C).
Figure 4
Figure 4
PCCT angiography of carotid artery bifurcation: mild calcified atherosclerosis. The PCCT angiography shows an ultra-high-definition (source dataset; matrix 1024 × 1024; slice thickness/increment 0.2/0.1 mm; voxel 100 microns; convolution kernel B60f; radiation dose comparable to equivalent CT angiography of the carotids with comparable Dual-source CT of the 3rd generation) carotid bifurcation with arterial wall thickening and mildly focal calcified plaque at the level of the proximal internal carotid artery (arrowhead).
Figure 5
Figure 5
PCCT angiography of carotid artery bifurcation: mild non calcified atherosclerosis. The PCCT angiography shows a longitudinally stretched curved multiplanar reformat of an ultra-high-definition (source dataset; matrix 1024 × 1024; slice thickness/increment 0.2/0.1 mm; voxel 100 microns; convolution kernel B60f; radiation dose comparable to equivalent CT angiography of the carotids with comparable Dual-source CT of the 3rd generation) carotid bifurcation with mild diffuse arterial wall noncalcified atherosclerosis.
Figure 6
Figure 6
PCCT angiography of carotid artery bifurcations: intermediate mixed and calcified atherosclerosis. The PCCT angiography shows 2 ultra-high-definition (source dataset; matrix 1024 × 1024; slice thickness/increment 0.2/0.1 mm; voxel 100 microns; convolution kernel B60f; radiation dose comparable to equivalent CT angiography of the carotids with comparable Dual-source CT of the 3rd generation) carotid bifurcations with severely calcified atherosclerotic plaque ((A); longitudinal and axial view) and intermediate/moderate mixed/calcified plaque ((B); longitudinal and axial view). To be noted is how the bulky and massive calcification of the plaque in (A) is totally distributed within the arterial wall and not affecting the visualization and quantification of eventual lumen stenosis.
Figure 7
Figure 7
PCCT angiography of carotid artery bifurcation: severe mixed atherosclerosis. The PCCT angiography shows an ultra-high-definition (source dataset; matrix 1024 × 1024; slice thickness/increment 0.2/0.1 mm; voxel 100 microns; convolution kernel B60f; radiation dose comparable to equivalent CT angiography of the carotids with comparable Dual-source CT of the 3rd generation) carotid bifurcation with severe mixed atherosclerotic plaque ((A): longitudinal view; (B): axial view). To be noted is the very sharp delineation of the bulky and massive calcification of the plaque both with respect to the remaining noncalcified component and with respect to the lumen definition.

References

    1. Taguchi K., Iwanczyk J.S. Vision 20/20: Single photon counting x-ray detectors in medical imaging. Med. Phys. 2013;40:100901. doi: 10.1118/1.4820371. - DOI - PMC - PubMed
    1. Flohr T., Petersilka M., Henning A., Ulzheimer S., Ferda J., Schmidt B. Photon-counting CT review. Phys. Med. 2020;79:126–136. doi: 10.1016/j.ejmp.2020.10.030. - DOI - PubMed
    1. McCollough C.H., Leng S., Yu L., Fletcher J.G. Dual- and Multi-Energy CT: Principles, Technical Approaches, and Clinical Applications. Radiology. 2015;276:637–653. doi: 10.1148/radiol.2015142631. - DOI - PMC - PubMed
    1. Sandfort V., Persson M., Pourmorteza A., Noël P.B., Fleischmann D., Willemink M.J. Spectral photon-counting CT in cardiovascular imaging. J. Cardiovasc. Comput. Tomogr. 2021;15:218–225. doi: 10.1016/j.jcct.2020.12.005. - DOI - PubMed
    1. Green B.N., Johnson C.D., Adams A. Writing narrative literature reviews for peer-reviewed journals: Secrets of the trade. J. Chiropr. Med. 2006;5:101–117. doi: 10.1016/S0899-3467(07)60142-6. - DOI - PMC - PubMed

LinkOut - more resources