

Potential Hepatic Lipid Markers Associated with Nonalcoholic Steatohepatitis and Fibrosis in Morbid Obesity Patients
- PMID: 37297926
- PMCID: PMC10253728
- DOI: 10.3390/jcm12113730
Potential Hepatic Lipid Markers Associated with Nonalcoholic Steatohepatitis and Fibrosis in Morbid Obesity Patients
Abstract
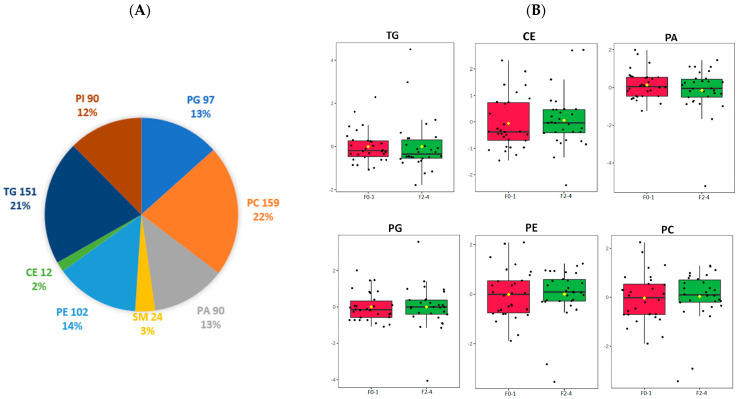
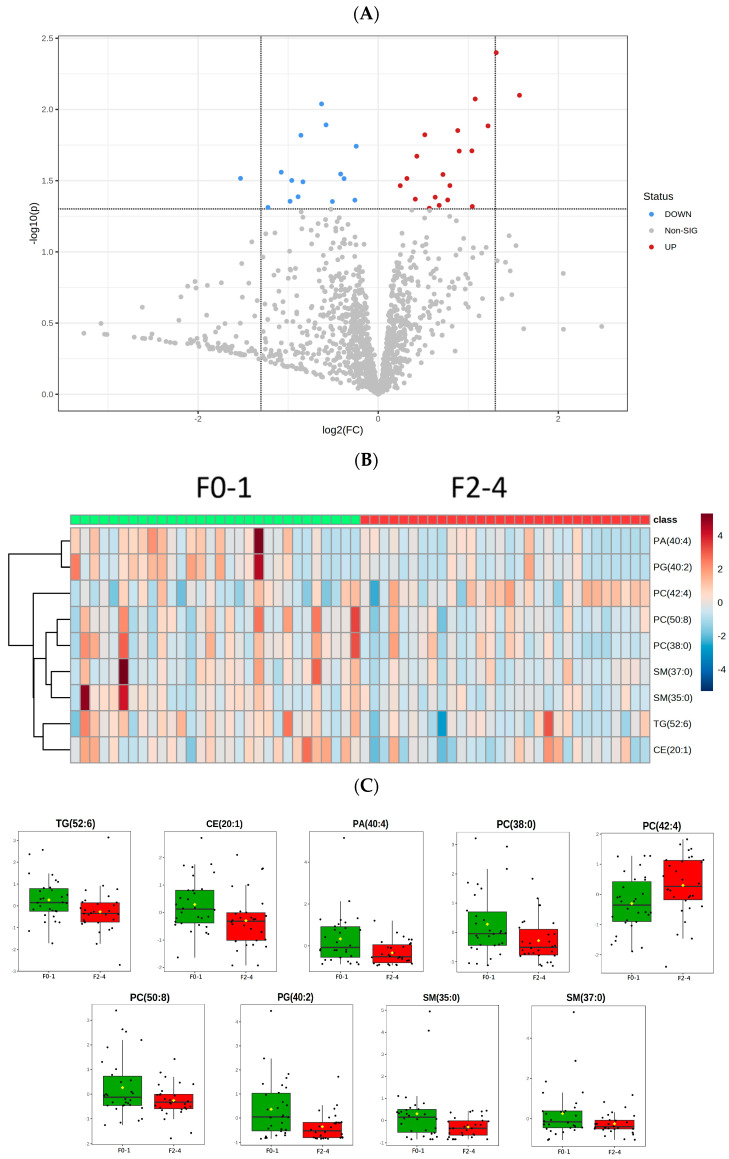
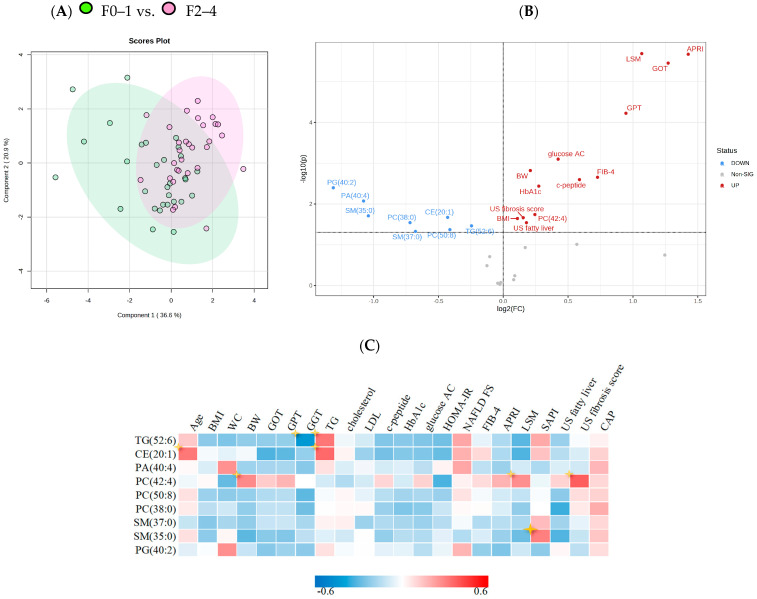
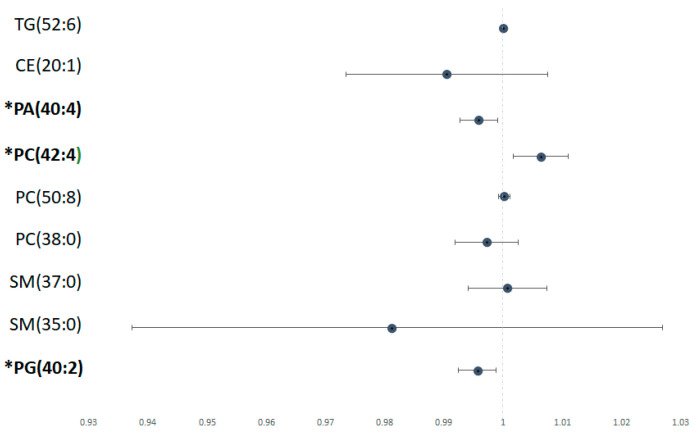
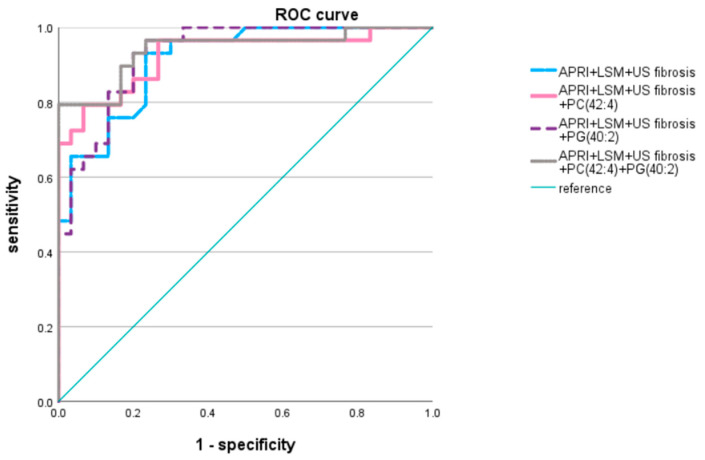
This study investigated differences in lipidomic profile features in nonalcoholic steatohepatitis (NASH) between mild and significant liver fibrosis cases among patients with morbid obesity. Wedge liver biopsy was performed during sleeve gastrectomy and significant liver fibrosis was defined as a fibrosis score ≥ 2. We selected patients with NASH with non/mild fibrosis (stage F0-F1; n = 30) and NASH with significant fibrosis (stage F2-F4; n = 30). The results of the liver tissue lipidomic analysis revealed that the fold changes of triglyceride (TG) (52:6); cholesterol ester (CE) (20:1); phosphatidylcholine (PC) (38:0) and (50:8); phosphatidic acid (PA) (40:4); phosphatidylinositol (PI) (49:4); phosphatidylglycerol (PG) (40:2); and sphingomyelin (SM) (35:0) and (37:0) were significantly lower in patients with NASH with F2-F4 than those with NASH with F0-F1 (p < 0.05). However, the fold changes of PC (42:4) were relatively higher in patients with NASH with stage 2-4 fibrosis (p < 0.05). Moreover, predictive models incorporating serum markers levels, ultrasonographic studies, and levels of specific lipid components [PC (42:4) and PG (40:2)] yielded the highest area under receiver operating curve (0.941), suggesting a potential correlation between NASH fibrosis stages and liver lipid accumulation among specific lipid species subclasses. This study demonstrated that the concentrations of particular lipid species in the liver correlate with NASH fibrosis stages and may indicate hepatic steatosis regression or progression in patients with morbid obesity.
Keywords: lipid profile analysis; liver fibrosis; nonalcoholic steatohepatitis.
Conflict of interest statement
The authors declare no conflict of interest.
Figures
Similar articles
-
LC-MS-based lipidomic analysis in distinguishing patients with nonalcoholic steatohepatitis from nonalcoholic fatty liver.Hepatobiliary Pancreat Dis Int. 2021 Oct;20(5):452-459. doi: 10.1016/j.hbpd.2021.05.008. Epub 2021 Jun 25. Hepatobiliary Pancreat Dis Int. 2021. PMID: 34256994
-
Clinical characteristics and management of patients with nonalcoholic steatohepatitis in a real-world setting: analysis of the Ipsos NASH therapy monitor database.BMC Gastroenterol. 2023 May 19;23(1):160. doi: 10.1186/s12876-023-02794-4. BMC Gastroenterol. 2023. PMID: 37208593 Free PMC article.
-
Metabolic signatures across the full spectrum of non-alcoholic fatty liver disease.JHEP Rep. 2022 Mar 26;4(5):100477. doi: 10.1016/j.jhepr.2022.100477. eCollection 2022 May. JHEP Rep. 2022. PMID: 35434590 Free PMC article.
-
A qualitative patient interview study to understand the experience of patients with nonalcoholic steatohepatitis.Hepatol Commun. 2023 Feb 9;7(3):e0036. doi: 10.1097/HC9.0000000000000036. eCollection 2023 Mar 1. Hepatol Commun. 2023. PMID: 36757391 Free PMC article. Review.
-
Etiopathogenesis of nonalcoholic steatohepatitis.Semin Liver Dis. 2001;21(1):27-41. doi: 10.1055/s-2001-12927. Semin Liver Dis. 2001. PMID: 11296694 Review.
Cited by
-
Machine Learning Models for Predicting Significant Liver Fibrosis in Patients with Severe Obesity and Nonalcoholic Fatty Liver Disease.Obes Surg. 2024 Dec;34(12):4393-4404. doi: 10.1007/s11695-024-07548-z. Epub 2024 Oct 25. Obes Surg. 2024. PMID: 39448457
-
Therapeutic implications for sphingolipid metabolism in metabolic dysfunction-associated steatohepatitis.Front Endocrinol (Lausanne). 2024 Jun 19;15:1400961. doi: 10.3389/fendo.2024.1400961. eCollection 2024. Front Endocrinol (Lausanne). 2024. PMID: 38962680 Free PMC article. Review.
References
-
- European Association for the Study of the Liver. European Association for the Study of Diabetes. European Association for the Study of Obesity EASL-EASD-EASO Clinical Practice Guidelines for the management of non-alcoholic fatty liver disease. J. Hepatol. 2016;64:1388–1402. doi: 10.1016/j.jhep.2015.11.004. - DOI - PubMed
-
- Wu W.-C., Wu C.-Y., Wang Y.-J., Hung H.-H., Yang H.-I., Kao W.-Y., Su C.-W., Wu J.-C., Chan W.-L., Lin H.-C., et al. Updated thresholds for serum alanine aminotransferase level in a large-scale population study composed of 34,346 subjects. Aliment. Pharmacol. Ther. 2012;36:560–568. doi: 10.1111/j.1365-2036.2012.05224.x. - DOI - PubMed
-
- Cheng Y.-L., Wang Y.-J., Kao W.-Y., Chen P.-H., Huo T.-I., Huang Y.-H., Lan K.-H., Su C.-W., Chan W.-L., Lin H.-C., et al. Inverse Association between Hepatitis B Virus Infection and Fatty Liver Disease: A Large-Scale Study in Populations Seeking for Check-Up. PLoS ONE. 2013;8:e72049. doi: 10.1371/journal.pone.0072049. - DOI - PMC - PubMed
Grants and funding
LinkOut - more resources
Full Text Sources
Research Materials
Miscellaneous
