. 2023 May 26;24(11):9284.
doi: 10.3390/ijms24119284.

Palbociclib-Induced Cellular Senescence Is Modulated by the mTOR Complex 1 and Autophagy

Affiliations

Palbociclib-Induced Cellular Senescence Is Modulated by the mTOR Complex 1 and Autophagy

Angel Cayo et al. Int J Mol Sci. .

Abstract

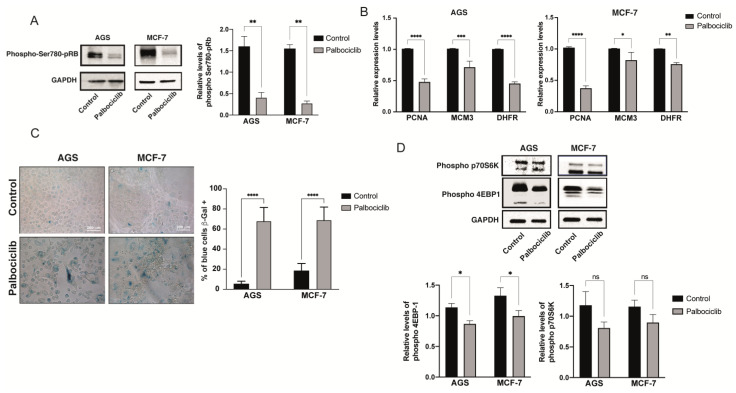
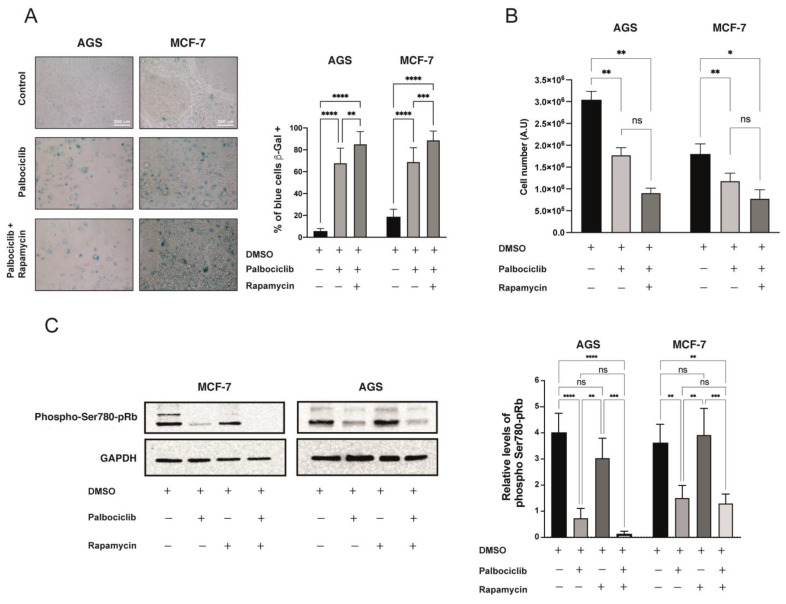
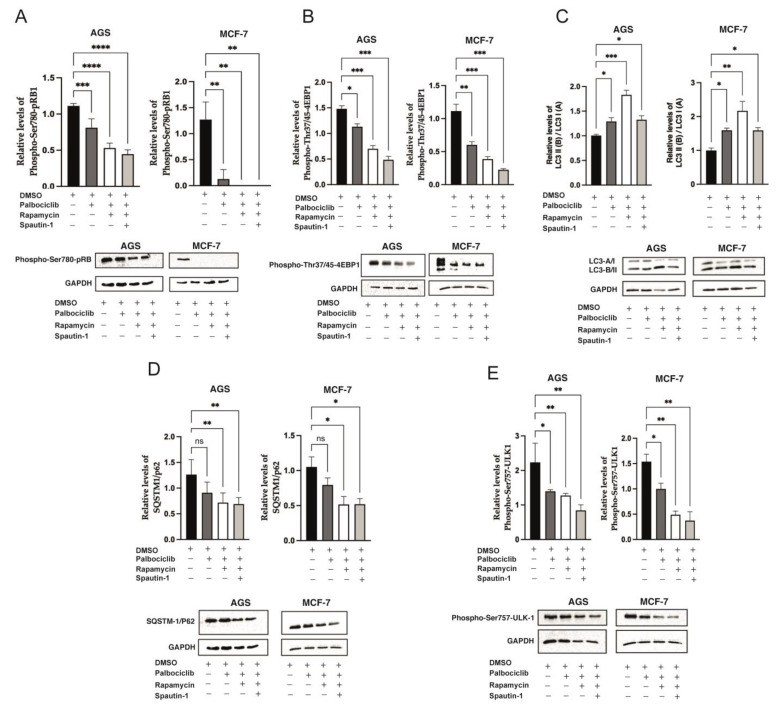
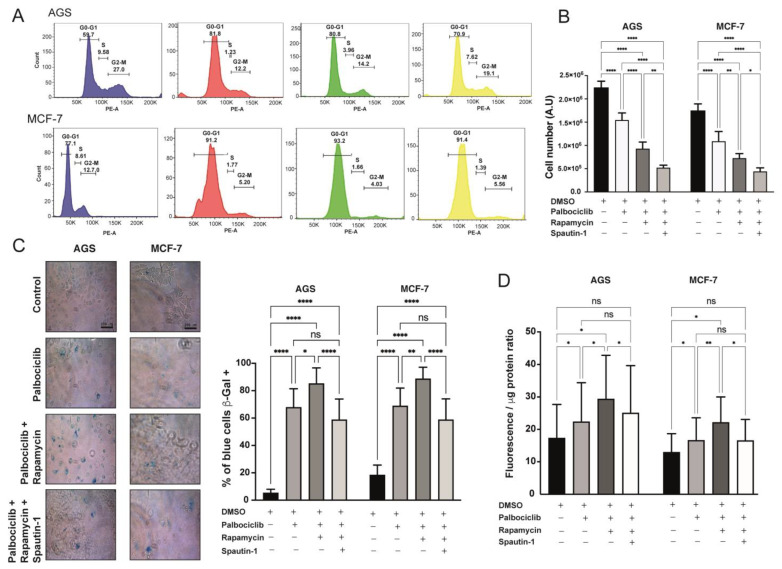
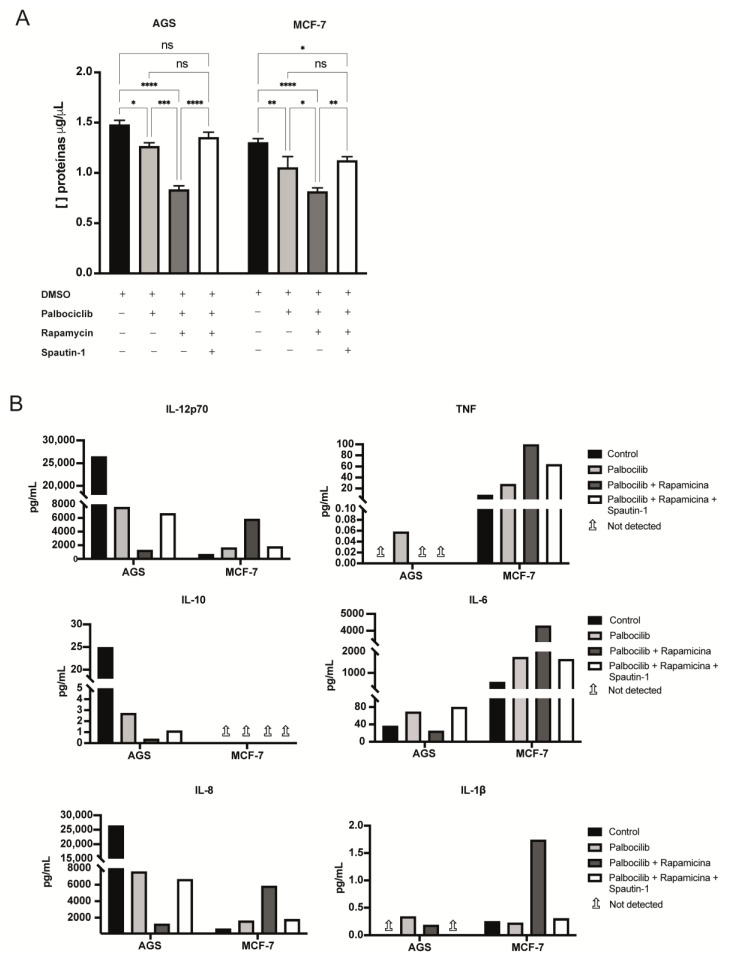
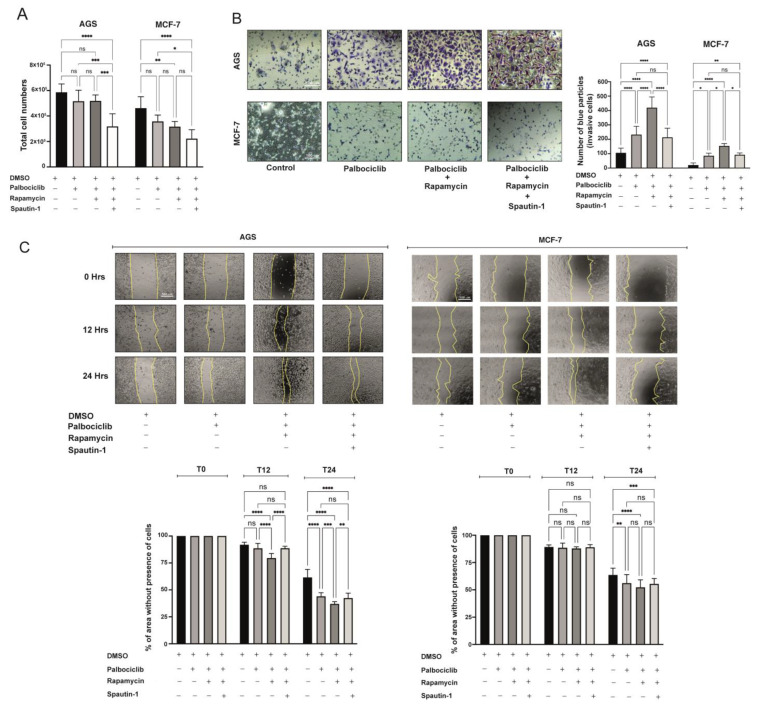
Despite not dividing, senescent cells acquire the ability to synthesize and secrete a plethora of bioactive molecules, a feature known as the senescence-associated secretory phenotype (SASP). In addition, senescent cells often upregulate autophagy, a catalytic process that improves cell viability in stress-challenged cells. Notably, this "senescence-related autophagy" can provide free amino acids for the activation of mTORC1 and the synthesis of SASP components. However, little is known about the functional status of mTORC1 in models of senescence induced by CDK4/6 inhibitors (e.g., Palbociclib), or the effects that the inhibition of mTORC1 or the combined inhibition of mTORC1 and autophagy have on senescence and the SASP. Herein, we examined the effects of mTORC1 inhibition, with or without concomitant autophagy inhibition, on Palbociclib-driven senescent AGS and MCF-7 cells. We also assessed the pro-tumorigenic effects of conditioned media from Palbociclib-driven senescent cells with the inhibition of mTORC1, or with the combined inhibition of mTORC1 and autophagy. We found that Palbociclib-driven senescent cells display a partially reduced activity of mTORC1 accompanied by increased levels of autophagy. Interestingly, further mTORC1 inhibition exacerbated the senescent phenotype, a phenomenon that was reversed upon autophagy inhibition. Finally, the SASP varied upon inhibiting mTORC1, or upon the combined inhibition of mTORC1 and autophagy, generating diverse responses in cell proliferation, invasion, and migration of non-senescent tumorigenic cells. Overall, variations in the SASP of Palbociclib-driven senescent cells with the concomitant inhibition of mTORC1 seem to depend on autophagy.

Keywords: autophagy; cancer; mTORC1; palbociclib; senescence; senescence-associated secretory phenotype.


Conflict of interest statement

The authors declare no conflict of interest.

Figures

Figure 1
Figure 1
Palbociclib-driven senescence in AGS and MCF-7 cells: (A) Phosphorylation at Serine-780 of the retinoblastoma protein (pRB) following exposure of AGS and MCF-7 cells to Palbociclib. A representative Western blot and a densitometric analysis of phospho-Ser-780 of pRB are shown. (B) qRT-PCR-based expression levels of cell cycle-associated genes in AGS and MCF-7 cells after 96 h of exposure to Palbociclib. (C) AGS and MCF-7 cells were exposed to 1 μM or 0.5 μM of Palbociclib for 96 h, respectively. Cells were then subjected to senescence-associated β-galactosidase assay (SA-β-Gal) and then visualized with bright field microscopy at 40× magnification. Images are representative of at least three experiments, performed independently. (D) Phosphorylation levels of mTORC1 target proteins, 4EBP-1 and p70S6K, after exposure of AGS and MCF-7 cells to Palbociclib. Right, densitometry of the intensities of the bands corresponding to phospho-4EBP-1 and phospho-p70S6, and their comparison with the intensity of the corresponding GAPDH band. Images are representative of at least three independent experiments. Error bars represent the mean ± SEM of three independent experiments. **** p < 0.0001, *** p < 0.001, ** p < 0.01, * p < 0.05, ns = no significant difference compared to DMSO based on Student’s t-test.
Figure 2
Figure 2
Senescence in cells treated with a combination of Palbociclib and Rapamycin: (A) AGS and MCF-7 cells were exposed to Palbociclib, or the combination of Palbociclib and Rapamycin, for 96 h. Cells were then subjected to Senescence-Associated β-Galactosidase assay (SA-β-Gal) and visualized with bright field microscopy at 40× magnification. Images are representative of at least three independent experiments. (B) AGS and MCF-7 cells were exposed to vehicle (DMSO), Palbociclib, or Palbociclib and Rapamycin, for 96 h. The number of viable cells was then quantified using the LUNA II counter. (C) The levels of phosphorylation in Serine-780 of the pRB (lower band) in cells previously exposed to the indicated experimental conditions were determined by Western blotting. Left: Densitometric analyses of the bands corresponding to phosphorylated Ser-780 of pRB, in comparison to the band of GAPDH. Error bars represent the mean ± SEM of three independent experiments. **** p < 0.0001, *** p < 0.001, ** p < 0.01, * p < 0.05, ns = no significant difference compared to DMSO based on two-way ANOVA with Tukey’s post-test.
Figure 3
Figure 3
Autophagy levels in cells treated with a combination of Palbociclib, Rapamycin, and Spautin-1: AGS and MCF-7 cells were exposed to vehicle (DMSO), Palbociclib, the combination of Palbociclib and Rapamycin, or the combination of Palbociclib, Rapamycin, and Spautin-1, for 96 h. The levels of (A) phosphorylation at Threonine-37/46 of 4E-BP1 and phosphorylation at Serine-389 of p70S6K; (B) phosphorylation at Serine-780 of pRB; (C) LC3-I and LC3-II; (D) SQSTM-1/p62; and (E) phosphorylation at Serine-757 of the ULK-1, in cells previously exposed to the indicated experimental conditions, were determined by Western blotting. Left: Densitometric analyses of the respective bands compared to the band of GAPDH. Error bars represent the mean ± SEM of three independent experiments. **** p < 0.0001, *** p < 0.001, ** p < 0.01, * p < 0.05, ns = no significant difference compared to DMSO based on two-way ANOVA with Tukey’s post-test.
Figure 4
Figure 4
Cell cycle analyses of senescent cells subjected to Rapamycin, or combined Rapamycin and Spautin-1, treatment: (A) AGS and MCF-7 cells subjected to the indicated pharmacological treatments (in all cases, 96 h of treatment) were suspended in 1×PBS, fixed in ethanol, incubated with RNAse A, and stained with Propidium Iodide. Cells were then analyzed by flow cytometry in order to determine the relative proportion of cells in different phases of the cell cycle. (B) AGS and MCF-7 cells were exposed to the indicated drugs, or drug combinations, for 96 h. The number of viable cells was quantified with LUNA II counter. Error bars represent the mean ± SEM of three independent experiments. **** p < 0.0001, ** p < 0.01, * p < 0.05, based on two-way ANOVA with Tukey’s post-test. (C) AGS and MCF-7 cells were exposed to the indicated drug, or combination of drugs, for 96 h. Cells were then subjected to senescence-associated b-galactosidase assay (SA-β-Gal) and visualized with bright field microscopy at 40x magnification. Error bars represent the mean ± SEM of three independent experiments. **** p < 0.0001, ** p < 0.01, * p < 0.05, ns = no significant difference compared to DMSO based on two-way ANOVA. (D) Results of fluorometry-based β-galactosidase activity assays (ENZ-KIT129-0120, Enzo Life Sciences) following 96 h exposure of AGS and MCF-7 cells to the indicated drugs, or combination of drugs, are shown. Fluorescence values were corrected by the respective amounts of total protein. The results of at least three independent experiments were compiled. Error bars represent the mean ± SEM of three independent experiments, ** p < 0.0021, * p < 0.0332, ns p < 0.1234 (no significance) in comparison to DMSO treatment; based on two-way ANOVA with Geisser–Greenhouse correction and multiple comparisons with Tukey’s post-test.
Figure 5
Figure 5
Detection of selected cytokines in conditioned media derived from senescent cells: (A) The concentration of total proteins in concentrated conditioned media derived from senescent cells exposed to the indicated drugs, or combination of drugs, was estimated using the Bradford assay. Error bars represent the mean ± SEM of two independent experiments. **** p < 0.0001, *** p < 0.001, ** p < 0.01, * p < 0.05, ns = no significant difference compared to DMSO based on two-way ANOVA. (B) Concentration of selected cytokines secreted by senescent cells subjected to different drug treatments. Arrows pointing up indicate that the molecule was not detected. The bar plots show a flow cytometry-based quantification (Human Inflammatory Cytokine Cytometric Bead Array) of the indicated cytokines detected in concentrated conditioned media derived from at least five cultures for each experimental condition.
Figure 6
Figure 6
Paracrine effects of Palbociclib-driven senescent cells with or without inhibition of mTORC1, or with combined inhibition of mTORC1 and autophagy: (A) Non-senescent (actively proliferating) AGS and MCF-7 cells were exposed for 72 h to conditioned media derived from Palbociclib-driven senescent cells, Palbociclib-driven senescent cells with mTORC1 inhibition, or Palbociclib-driven senescent cells with combined mTORC1 and autophagy inhibition. All conditioned media were diluted in complete media supplemented with 0.5% FBS. The number of accumulated viable cells was determined by LUNA II counter. Error bars represent the mean ± SEM of three independent experiments. **** p < 0.0001, *** p < 0.001, ** p < 0.01, * p < 0.05, ns = no significant difference compared to DMSO, based on two-way ANOVA. (B) Non-senescent AGS and MCF-7 cells were exposed to conditioned media derived from Palbociclib-driven senescent cells, Palbociclib-driven senescent cells with mTORC1 inhibition, or Palbociclib-driven senescent cells with combined mTORC1 and autophagy inhibition. The ability of non-senescent AGS and MCF-7 cells to migrate through a fibronectin-coated porous polycarbonate membrane towards the lower compartment of a Transwell chamber (containing the conditioned medium) was assessed after 6–8 h of incubation. Images were captured at 10× magnification following the staining of the cells with a 0.2% Blue Violet solution. The images were further analyzed with the Image J Program. Results of three independent assays, in which at least eight microscopic fields per condition were analyzed, are shown. (C) Wound healing, migration, assays for non-senescent AGS and MCF-7 cells exposed to conditioned media derived from Palbociclib-driven senescent cells, Palbociclib-driven senescent cells with mTORC1 inhibition, or Palbociclib-driven senescent cells with combined mTORC1 and autophagy inhibition. All conditioned media were diluted in complete media supplemented with 0.5% FBS. Wound closure was assessed at time 0 (T0), and after 12 (T12), 24 (T24), and 48 (T48) hours of incubation in the respective conditioned medium. Images were captured at 10× magnification and further analyzed with the Image J Program. Results of two independent assays, performed in duplicate, were plotted. In each case, at least nine fields per condition were analyzed.

References

    1. van Deursen J.M. The role of senescent cells in ageing. Nature. 2014;509:439–446. doi: 10.1038/nature13193. - DOI - PMC - PubMed
    1. Di Micco R., Krizhanovsky V., Baker D., d’Adda di Fagagna F. Cellular senescence in ageing: From mechanisms to therapeutic opportunities. Nat. Rev. Mol. Cell Biol. 2021;22:75–95. doi: 10.1038/s41580-020-00314-w. - DOI - PMC - PubMed
    1. Collado M., Serrano M. Senescence in tumours: Evidence from mice and humans. Nat. Rev. Cancer. 2010;10:51–57. doi: 10.1038/nrc2772. - DOI - PMC - PubMed
    1. Gal H., Majewska J., Krizhanovsky V. The intricate nature of senescence in development and cell plasticity. Semin. Cancer Biol. 2021;87:214–219. doi: 10.1016/j.semcancer.2021.01.004. - DOI - PubMed
    1. Yun M. Cellular senescence in tissue repair: Every cloud has a silver lining. Int. J. Dev. Biol. 2018;62:591–604. doi: 10.1387/ijdb.180081my. - DOI - PubMed

LinkOut - more resources