. 2023 May 28;24(11):9398.
doi: 10.3390/ijms24119398.

TRAX-CHEMxt: Towards the Homogeneous Chemical Stage of Radiation Damage

Affiliations

TRAX-CHEMxt: Towards the Homogeneous Chemical Stage of Radiation Damage

Gianmarco Camazzola et al. Int J Mol Sci. .

Abstract

The indirect effect of radiation plays an important role in radio-induced biological damages. Monte Carlo codes have been widely used in recent years to study the chemical evolution of particle tracks. However, due to the large computational efforts required, their applicability is typically limited to simulations in pure water targets and to temporal scales up to the µs. In this work, a new extension of TRAX-CHEM is presented, namely TRAX-CHEMxt, able to predict the chemical yields at longer times, with the capability of exploring the homogeneous biochemical stage. Based on the species coordinates produced around one track, the set of reaction-diffusion equations is solved numerically with a computationally light approach based on concentration distributions. In the overlapping time scale (500 ns-1 µs), a very good agreement to standard TRAX-CHEM is found, with deviations below 6% for different beam qualities and oxygenations. Moreover, an improvement in the computational speed by more than three orders of magnitude is achieved. The results of this work are also compared with those from another Monte Carlo-based algorithm and a fully homogeneous code (Kinetiscope). TRAX-CHEMxt will allow for studying the variation in chemical endpoints at longer timescales with the introduction, as the next step, of biomolecules, for more realistic assessments of biological response under different radiation and environmental conditions.

Keywords: chemical track structure; homogeneous biochemical stage; radical/molecule yields; reaction–diffusion equations.


Conflict of interest statement

The authors declare no conflict of interest.

Figures

Figure 1
Figure 1
Illustration of the time scales of radiobiological events. In the upper part, examples of chemical track evolution simulations already available in TRAX-CHEM are shown. At the same time, some ingredients that have to be considered to investigate the biochemical stage (DNA nucleotides, enzymes such as superoxide dismutase and lipids) are also depicted.
Figure 2
Figure 2
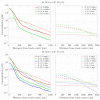
Deviations at 1 µs as a function of the time chosen to pass the species localisation information from TRAX-CHEM to TRAX-CHEMxt. The deviations are determined by the difference between the total number of every radical and molecule predicted by TRAX-CHEMxt and the respective quantity produced by TRAX-CHEM, divided by the latter. Tests on two radiation qualities are shown, namely 500 keV electron beam (top) and 150 MeV/u carbon beam (bottom), in a water target under pO2 of, respectively, 1% and 7%. Grey dash–dotted lines are introduced to mark deviations of ±2%.
Figure 3
Figure 3
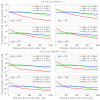
Distributions’ sums, at different time points, of the three species categories produced by a 40 MeV/u carbon beam in 0% pO2 (top) and 3% pO2 (bottom) water targets. Category (i): OH, H3O+, H and eaq; category (ii): H2, H2O2 and OH; category (iii): HO2, O2 and HO2. Initial data taken at tin = 600 ns.
Figure 4
Figure 4
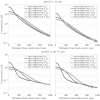
G-values up to 1 ms of the species produced by a 40 MeV/u carbon beam in 0% pO2 (left) and 3% pO2 (right) water targets. In the bottom row, insets between 600 ns and 1 ms of the curves presented in the top row are reported. Initial data taken at tin = 600 ns (grey dashed lines).
Figure 5
Figure 5
Distributions’ sums, at 500 ns, 25 µs and 100 µs, of the three species categories for increasing LET values, respectively, ∼1 keV/µm, ∼13 keV/µm and ∼160 keV/µm, under pO2 = 21%. Category (i): OH, H3O+, H and eaq; category (ii): H2, H2O2 and OH; category (iii): HO2, O2 and HO2. Initial data taken at tin = 500 ns.
Figure 6
Figure 6
(left) G-values of all the species produced by different LET radiations, recorded at 500 ns, 25 µs and 100 µs. (right) Ratios between the G-values at 25 µs and 500 ns. The environment was kept at pO2 = 21%. Initial data taken at tin = 500 ns.
Figure 7
Figure 7
Effects of target oxygenation on the concentration distribution of (HO2+O2), recorded at three time points (500 ns, 25 µs, 100 µs), for a low (∼0.2 keV/µm, top) and a high (∼28 keV/µm, bottom) LET radiation. Initial data taken at tin = 500 ns.
Figure 8
Figure 8
(left) G-values for (HO2+O2) as a function of pO2, recorded at 500 ns, 25 µs and 100 µs, from radiations with LET of ∼0.2 keV/µm and ∼28 keV/µm. (right) Ratios between the G-values at 25 µs and 500 ns. Initial data taken at tin = 500 ns.
Figure 9
Figure 9
Examples of compared radial distributions for OH and H2O2, produced by a 500 keV electron beam (top) and a 150 MeV/u carbon beam (bottom), under oxygenation conditions of, respectively, 1% and 7%. Initial data taken at tin = 600 ns.
Figure 10
Figure 10
Example of compared G-values for the species produced by a 40 MeV/u carbon beam in a water environment with pO2 = 3%, up to 10 µs. On the right side, an inset to visualise the differences within the overlapping time scale 600 ns–10 µs. Initial data taken at tin = 600 ns (grey dashed line).
Figure 11
Figure 11
G-values of the main species produced by a 65 MeV proton beam in a water environment with pO2 = 21%. Solid lines correspond to the results from TRAX-CHEM and TRAX-CHEMxt, whereas the dashed ones to those from Colliaux et al. [20]. The extension took over the simulation at 500 ns.
Figure 12
Figure 12
Deviations between Kinetiscope and TRAX-CHEMxt, registered for different beam qualities, oxygenation conditions and final time points. Marked with dash–dotted lines are discrepancies of ±1%, ±3%, ±30% and ±60%. Initial data handed over to both codes at 1 µs.
Figure 13
Figure 13
Species produced by a 90 MeV/u carbon ion in a water target with pO2 = 2% (generated by TRAX-CHEM). The screenshot was taken at 600 ns from the initial physical interactions. Clearly visible is the effect of a secondary electron resulting in an energy deposition away from the track center.
Figure 14
Figure 14
Scheme of the different “phases” featuring the extended simulation. After following every single radical and molecule produced around the track centre, the information is converted into one concentration distribution per species. In the end, once these concentrations reach a uniform value, the classical homogeneous reaction model comes into play.

References

    1. Scifoni E. Radiation biophysical aspects of charged particles: From the nanoscale to therapy. Mod. Phys. Lett. A. 2015;30:1540019. doi: 10.1142/S0217732315400192. - DOI
    1. Mairani A., Mein S., Blakely E., Debus J., Durante M., Ferrari A., Fuchs H., Georg D., Grosshans D.R., Guan F., et al. Roadmap: Helium ion therapy. Phys. Med. Biol. 2022;67:15. doi: 10.1088/1361-6560/ac65d3. - DOI - PubMed
    1. Alanazi A., Meesungnoen J., Jay-Gerin J.P. A computer modeling study of water radiolysis at high dose rates. Relevance to FLASH radiotherapy. Radiat. Res. 2020;195:149–162. doi: 10.1667/RADE-20-00168.1. - DOI - PubMed
    1. Michaels H.B., Hunt J.W. A model for radiation damage in cells by direct effect and by indirect effect: A radiation chemistry approach. Radiat. Res. 1978;74:23–34. doi: 10.2307/3574754. - DOI - PubMed
    1. Meesat R., Sanguanmith S., Meesungnoen J., Lepage M., Khalil A., Jay-Gerin J.P. Utilization of the ferrous sulfate (Fricke) dosimeter for evaluating the radioprotective potential of cystamine: Experiment and Monte Carlo simulation. Radiat. Res. 2012;177:813–826. doi: 10.1667/RR2829.1. - DOI - PubMed

LinkOut - more resources