. 2023 May 31;24(11):9550.
doi: 10.3390/ijms24119550.

Secondary Structures of MERS-CoV, SARS-CoV, and SARS-CoV-2 Spike Proteins Revealed by Infrared Vibrational Spectroscopy

Affiliations

Secondary Structures of MERS-CoV, SARS-CoV, and SARS-CoV-2 Spike Proteins Revealed by Infrared Vibrational Spectroscopy

Annalisa D'Arco et al. Int J Mol Sci. .

Abstract

All coronaviruses are characterized by spike glycoproteins whose S1 subunits contain the receptor binding domain (RBD). The RBD anchors the virus to the host cellular membrane to regulate the virus transmissibility and infectious process. Although the protein/receptor interaction mainly depends on the spike's conformation, particularly on its S1 unit, their secondary structures are poorly known. In this paper, the S1 conformation was investigated for MERS-CoV, SARS-CoV, and SARS-CoV-2 at serological pH by measuring their Amide I infrared absorption bands. The SARS-CoV-2 S1 secondary structure revealed a strong difference compared to those of MERS-CoV and SARS-CoV, with a significant presence of extended β-sheets. Furthermore, the conformation of the SARS-CoV-2 S1 showed a significant change by moving from serological pH to mild acidic and alkaline pH conditions. Both results suggest the capability of infrared spectroscopy to follow the secondary structure adaptation of the SARS-CoV-2 S1 to different environments.

Keywords: ATR-IR spectroscopy; MERS-CoV; SARS-CoV; SARS-CoV-2; conformation; secondary structure; spike glycoproteins.


Conflict of interest statement

The authors declare no conflict of interest.

Figures

Figure 1
Figure 1
The SARS CoV-2 virion structure. (a) Model of the SARS-CoV-2 virion and schematic diagram: its structural proteins (spike glycoprotein S in blue, membrane protein M in red, and envelope glycoprotein E in yellow) is shown on the surface, and the nucleocapsid protein plus mRNA are shown inside the virion. (b) Detail of the S glycoprotein and its subunits S1 and S2. (c) Further detail of the S1 subunit, which was the object of this experimental study.
Figure 2
Figure 2
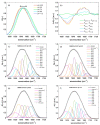
Comparison of amide I S1 absorption spectra. (a) A direct comparison among the S1 absorption of MERS-CoV (blue line), SARS-CoV (red line), and SARS-CoV-2 (yellow line). In the inset of the same panel, we report the differences for A(ω)(SARS-CoV-2)-A(ω)(SARS-CoV) (red line) and A(ω)(SARS-CoV-2)-A(ω)(MERS-CoV) (blue line) in comparison to the reproducibility of the SARS-CoV-2 absorption spectra. This was estimated by the difference for A(ω)(SARS-CoV-2)-A(ω)(SARS-CoV-2) for two separate measurement runs (yellow line). Panels (bd) compare the absorption spectra of MERS-CoV, SARS-CoV, and SARS-CoV-2 (black lines), as well as their decomposition based on Gaussian peaks (colored lines) and the global fitting (empty circles).
Figure 3
Figure 3
Amide I SARS-CoV-2 S1 absorption spectra at different pH values. In (a), a direct comparison among SARS-CoV-2 S1 absorption spectra when varying the pH from acid to alkaline conditions is shown. In (b), the differences for A(ω)(pH=7.4)-A(ω)(pH=4.55) (green line), A(ω)(pH=7.4)-A(ω)(pH=5.5) (light blue line), A(ω)(pH=7.4)-A(ω)(pH=8.8) (violet line), and A(ω)(pH=7.4)-A(ω)(pH=11.3) (blue line) in comparison to the reproducibility at pH = 7.4 are shown. Panels (cf) instead show the deconvoluted absorption spectra of the SARS-CoV-2 S1 units at different pH levels (black lines) superimposed to the global fitting (empty circles) and the Gaussian component decompositions (colored lines).
Figure 4
Figure 4
The percentages of β-sheet, α-helix, random-coil, and β-turn secondary structures vs. pHs from acid (red and yellow regions) to alkaline (cyan and blue regions) levels.

References

    1. Li Q., Guan X., Wu P., Wang X., Zhou L., Tong Y., Ren R., Leung K.S.M., Lau E.H.Y., Wong J.Y., et al. Early Transmission Dynamics in Wuhan, China, of Novel Coronavirus-Infected Pneumonia. N. Engl. J. Med. 2020;382:1199–1207. doi: 10.1056/NEJMoa2001316. - DOI - PMC - PubMed
    1. Huang C., Wang Y., Li X., Ren L., Zhao J., Hu Y., Zhang L., Fan G., Xu J., Gu X., et al. Clinical features of patients infected with 2019 novel coronavirus in Wuhan, China. Lancet. 2020;395:497–506. doi: 10.1016/S0140-6736(20)30183-5. - DOI - PMC - PubMed
    1. Huang Y., Yang C., Xu X.-F., Xu W., Liu S.W. Structural and functional properties of SARS-CoV-2 spike protein: Potential antivirus drug development for COVID-19. Acta Pharmacol. Sin. 2020;41:1141–1149. doi: 10.1038/s41401-020-0485-4. - DOI - PMC - PubMed
    1. Zhu N., Zhang D., Wang W., Li X., Yang B., Song J., Zhao X., Huang B., Shi W., Lu R., et al. A Novel Coronavirus from Patients with Pneumonia in China. N. Engl. J. Med. 2019;382:727–733. doi: 10.1056/NEJMoa2001017. - DOI - PMC - PubMed
    1. Drosten C., Günther S., Preiser W., van der Werf S., Brodt H.R., Becker S., Rabenau H., Panning M., Kolesnikova L., Fouchier R.A.M., et al. Identification of a novel coronavirus in patients with severe acute respiratory syndrome. N. Engl. J. Med. 2003;348:1967–1976. doi: 10.1056/NEJMoa030747. - DOI - PubMed

Substances