. 2023 May 31;24(11):9586.
doi: 10.3390/ijms24119586.

Chromatographic Scalable Method to Isolate Engineered Extracellular Vesicles Derived from Mesenchymal Stem Cells for the Treatment of Liver Fibrosis in Mice

Affiliations

Chromatographic Scalable Method to Isolate Engineered Extracellular Vesicles Derived from Mesenchymal Stem Cells for the Treatment of Liver Fibrosis in Mice

Luciana M Domínguez et al. Int J Mol Sci. .

Abstract

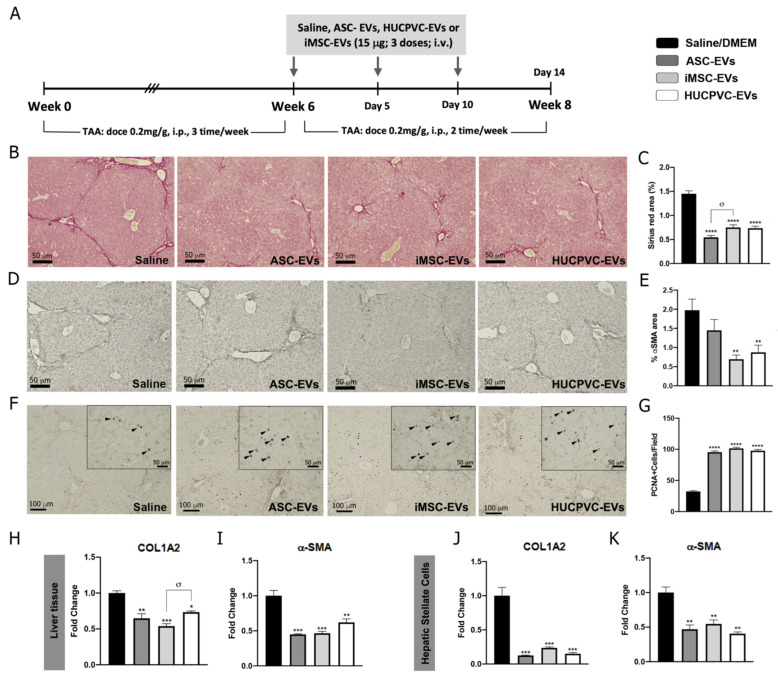
New therapeutic options for liver cirrhosis are needed. Mesenchymal stem cell (MSC)-derived extracellular vesicles (EVs) have emerged as a promising tool for delivering therapeutic factors in regenerative medicine. Our aim is to establish a new therapeutic tool that employs EVs derived from MSCs to deliver therapeutic factors for liver fibrosis. EVs were isolated from supernatants of adipose tissue MSCs, induced-pluripotent-stem-cell-derived MSCs, and umbilical cord perivascular cells (HUCPVC-EVs) by ion exchange chromatography (IEC). To produce engineered EVs, HUCPVCs were transduced with adenoviruses that code for insulin-like growth factor 1 (AdhIGF-I-HUCPVC-EVs) or green fluorescent protein. EVs were characterized by electron microscopy, flow cytometry, ELISA, and proteomic analysis. We evaluated EVs' antifibrotic effect in thioacetamide-induced liver fibrosis in mice and on hepatic stellate cells in vitro. We found that IEC-isolated HUCPVC-EVs have an analogous phenotype and antifibrotic activity to those isolated by ultracentrifugation. EVs derived from the three MSCs sources showed a similar phenotype and antifibrotic potential. EVs derived from AdhIGF-I-HUCPVC carried IGF-1 and showed a higher therapeutic effect in vitro and in vivo. Remarkably, proteomic analysis revealed that HUCPVC-EVs carry key proteins involved in their antifibrotic process. This scalable MSC-derived EV manufacturing strategy is a promising therapeutic tool for liver fibrosis.

Keywords: chromatography EVs isolation; engineered EVs; extracellular vesicles; liver fibrosis; mesenchymal stromal cells.


Conflict of interest statement

The authors declare that they have not conflict of interests.

Figures

Figure 1
Figure 1
Validation of ion exchange chromatography method to isolate EVs. (A) Scheme of EV isolation by ion exchange chromatography. HUCPVCs were incubated for 48 h in Fetal Bovine Serum (FBS)-free medium and the cell culture supernatant collected. Supernatant was centrifuged at 5000 rpm to discard the cellular debris and then applied directly to a column containing the anion exchange resin. After the total volume of HUCPVC supernatant crosses the resin, negatively charged EVs (red “-“ symbols) were retained on the positive charged resin (green “+” symbol). Then, the column was washed and eluted in 8 fractions of 1 mL elution buffer solution. (B) Protein quantification by BCA assays of eluted chromatography fractions. (C,D) EV characterization by MRPS and transmission electron microscopy. Left panel: graph showing quantification and size distribution analysis of fractions #3, #4, and #5 of chromatography and ultracentrifugation pellet assessed by MRPS. Right panel: electron microphotography (scale bar = 100 nm) of HUCPVC-derived EVs isolated by ion exchange chromatography and ultracentrifugation, respectively. (E) Confirmation of EV presence on eluted fraction by flow cytometry for CD9 and CD81 EV markers. EVs isolated by ultracentrifugation were used for comparison. Preparation of samples was carried out by trapping EVs with CD63-antibody-coated beads and incubated with specific antibodies conjugated with PE (red line histograms). Beads alone were used as control (black histogram). Graphs show 1 of 3 independent experiments each performed in duplicate. (F,G) In vitro analysis of EV biological function for liver fibrosis therapy. Hepatic stellate cells (CFSC-2G cell line) were incubated with fractions #3, #4, or #5, a pool of fraction 3–4–5, or EVs isolated by ultracentrifugation (1 µg/mL). DMEM was used as untreated control. After 18 h of incubation, mRNA expression levels of COL1A2 and α-SMA was evaluated by qPCR. Graph shows average of 3 independent experiments performed in triplicate. * p < 0.01; ** p < 0.001; **** p < 0.0001; vs. saline (ANOVA and Tukey’s post-test).
Figure 1
Figure 1
Validation of ion exchange chromatography method to isolate EVs. (A) Scheme of EV isolation by ion exchange chromatography. HUCPVCs were incubated for 48 h in Fetal Bovine Serum (FBS)-free medium and the cell culture supernatant collected. Supernatant was centrifuged at 5000 rpm to discard the cellular debris and then applied directly to a column containing the anion exchange resin. After the total volume of HUCPVC supernatant crosses the resin, negatively charged EVs (red “-“ symbols) were retained on the positive charged resin (green “+” symbol). Then, the column was washed and eluted in 8 fractions of 1 mL elution buffer solution. (B) Protein quantification by BCA assays of eluted chromatography fractions. (C,D) EV characterization by MRPS and transmission electron microscopy. Left panel: graph showing quantification and size distribution analysis of fractions #3, #4, and #5 of chromatography and ultracentrifugation pellet assessed by MRPS. Right panel: electron microphotography (scale bar = 100 nm) of HUCPVC-derived EVs isolated by ion exchange chromatography and ultracentrifugation, respectively. (E) Confirmation of EV presence on eluted fraction by flow cytometry for CD9 and CD81 EV markers. EVs isolated by ultracentrifugation were used for comparison. Preparation of samples was carried out by trapping EVs with CD63-antibody-coated beads and incubated with specific antibodies conjugated with PE (red line histograms). Beads alone were used as control (black histogram). Graphs show 1 of 3 independent experiments each performed in duplicate. (F,G) In vitro analysis of EV biological function for liver fibrosis therapy. Hepatic stellate cells (CFSC-2G cell line) were incubated with fractions #3, #4, or #5, a pool of fraction 3–4–5, or EVs isolated by ultracentrifugation (1 µg/mL). DMEM was used as untreated control. After 18 h of incubation, mRNA expression levels of COL1A2 and α-SMA was evaluated by qPCR. Graph shows average of 3 independent experiments performed in triplicate. * p < 0.01; ** p < 0.001; **** p < 0.0001; vs. saline (ANOVA and Tukey’s post-test).
Figure 2
Figure 2
Isolation and characterization of EVs derived from MSCs. (A) Scheme of protocol for EV production from human umbilical cord perivascular cells (HUCPVCs-EVs), adipose tissue MSCs (ASC-EVs), and iPSC-derived MSCs (iMSCs-EVs). EVs were isolated by ion exchange chromatography from MSC supernatants after 48 h of culture in fetal-bovine-serum-deprived media. Negatively charged EVs (red “-“symbols), positive charged resin (green “+” symbol). (BD) Protein quantification by BCA assays of eluted chromatography fractions on the ASC-EV, iPSC-EV, and HUCPVC-EV isolation. (E) Histogram of CD9 and CD81 EV marker analysis by flow cytometry. Preparation of the ASC-EVs, iMSC-EVs, and HUCPVC-EVs was carried out by trapping EVs with CD63-antibody-coated beads and incubated with specific antibodies conjugated with PE (red line histograms). Beads alone were uses as control (black histogram). Graphs show 1 of 3 independent experiments each performed in duplicate. (F) EV quantification and size distribution analysis assessed by MRPS.
Figure 2
Figure 2
Isolation and characterization of EVs derived from MSCs. (A) Scheme of protocol for EV production from human umbilical cord perivascular cells (HUCPVCs-EVs), adipose tissue MSCs (ASC-EVs), and iPSC-derived MSCs (iMSCs-EVs). EVs were isolated by ion exchange chromatography from MSC supernatants after 48 h of culture in fetal-bovine-serum-deprived media. Negatively charged EVs (red “-“symbols), positive charged resin (green “+” symbol). (BD) Protein quantification by BCA assays of eluted chromatography fractions on the ASC-EV, iPSC-EV, and HUCPVC-EV isolation. (E) Histogram of CD9 and CD81 EV marker analysis by flow cytometry. Preparation of the ASC-EVs, iMSC-EVs, and HUCPVC-EVs was carried out by trapping EVs with CD63-antibody-coated beads and incubated with specific antibodies conjugated with PE (red line histograms). Beads alone were uses as control (black histogram). Graphs show 1 of 3 independent experiments each performed in duplicate. (F) EV quantification and size distribution analysis assessed by MRPS.
Figure 3
Figure 3
MSC-EV treatment from different sources ameliorates liver fibrosis and promotes hepatic regeneration. (A) Experimental design of EV therapy with ASC-EVs, iMSC-EVs, and HUCPVC-EVs. Saline solution was used as vehicle control. Liver fibrosis was induced by TAA administration for 8 weeks (200 mg/Kg/dose, 3 dose/week). At week 6, EVs or vehicle were i.v. administered every 5 days, 15 μg/animal/dose for a total of 3 doses. Animals were euthanized at week 8. Analysis of liver fibrosis by Sirius Red staining: (B) representative images of stained liver section (scale bars: 100 mm) and (C) morphometric quantification of collagen deposits. Analysis of in vivo HSC activation by α-SMA immunostaining: (D) representative images of stained liver sections (scale bars: 100 mm), and (E) morphometric quantification of α-SMA-positive area. Analysis of liver regeneration by PCNA immunostaining: (F) representative images of stained liver sections (scale bars: 100 mm), squares show 4× amplified images (with PCNA-positive cells indicated by arrowheads), and (G) PCNA-positive cell quantification (n = 10 for each group). (H,I) Analysis of COL1A2 and α-SMA mRNA levels in liver sample of mice 14 days after first dose of EVs. (J,K) In vitro analysis of COL1A2 and α-SMA mRNA expression on hepatic stellate cells (CFSC-2G cell line) 18 h after EV treatment (1 µg/mL). DMEM was used as untreated control. Graph shows average of 3 independent experiments performed in triplicate. * p < 0.05; ** p < 0.01; *** p < 0.001; **** p < 0.0001; * vs. saline; σ vs. iMSC-EVs (ANOVA and Tukey’s post test). Saline/DMEM (black bars), ASC-EVs (dark gray bars), iPSC-EVs (light gray bars), and HUCPVC-EVs (white bars).
Figure 4
Figure 4
EVs derived from AdhIGFI-HUCPVCs retain the specific cargo of IGF-I after being isolated by chromatography. (A) Protein quantification by BCA assays of eluted chromatography fractions on the AdhIGFI-HUCPVC-EV, AdGFP-HUCPVC-EV, and HUCPVC-EV isolation. (B) IGF-I quantification by ELISA on eluted chromatography fractions. (C) Histogram of CD9 and CD81 EV marker analysis by flow cytometry. Preparation was carried out by trapping EVs with CD63-antibody-coated beads and incubated with specific antibodies conjugated with PE (red line histograms) and beads alone as control (black lines histogram). (D) EV quantification and size distribution analysis assessed by MRPS. (E) Experimental design of EV processing to determine IGF-I localization. EVs isolated by chomatography were dialyzed on 300 kDa membrane against PBS and lysated on lysis buffer. (F) Dosage of IGF-I in EVs derived from AdhIGFI-HUCPVCs, lysated (gray bars) or non-lysated (black bars), with or without dialysis, determined by ELISA. Increased IGF-I levels were observed on lysed–dialyzed AdhIGFI-HUCPVC-EVs; **** p < 0.0001; ** p < 0.01 vs. lysed condition (ANOVA and Tukey’s post-test). Graph shows average of 3 independent experiments performed in triplicate each.
Figure 5
Figure 5
AdhIGFI-HUCPVCs-derived EV treatment isolated by chromatography ameliorates liver fibrosis. (A) Experimental design. AdhIGFI-HUCPVC-EVs, AdGFP-HUCPVC-EVs (15 μg/animal/dose, every 5 days for a total of 3 doses), or vehicle were administrated after 6 weeks of liver fibrosis induction by TAA administration. Animals were euthanized at week 8. Analysis of liver fibrosis by Sirius Red staining: (B) representative photomicrographs of stained liver section (scale bars: 100 mm) and (C) morphometric quantification of collagen deposits. Analysis of in vivo HSC activation by α-SMA immunostaining: (D) representative photomicrographs of stained liver sections (scale bars: 100 mm), and (E) morphometric quantification of α-SMA positive area. Analysis of liver regeneration by PCNA immunostaining: (F) representative photomicrographs of stained liver sections (scale bars: 100 mm), squares show 4× amplified images (with PCNA-positive cells indicated by arrowheads), and (G) PCNA-positive cell quantification (n = 10 for each group). (H,I) Analysis of COL1A2 and α-SMA mRNA levels in liver sample of mice 14 days after first dose of EVs. (J,K) In vitro analysis of COL1A2 and α-SMA mRNA expression on hepatic stellate cells (CFSC-2G cell line) 18 h after incubation with EVs (1 µg/mL). DMEM was used as untreated control. Graph shows average of 3 independent experiments performed in triplicate. Saline/DMEM (white bars), AdGFP-HUCPVC-EVs (gray bars), or AdhIGFI-HUCPVC-EVs (black bars) administration. * p < 0.05; ** λλ p < 0.001; *** p < 0.0005, **** λλλλ p < 0.0001; * vs. saline; λ vs. AdGFP-HUCPVC-EVs; (ANOVA and Tukey’s post-test).
Figure 5
Figure 5
AdhIGFI-HUCPVCs-derived EV treatment isolated by chromatography ameliorates liver fibrosis. (A) Experimental design. AdhIGFI-HUCPVC-EVs, AdGFP-HUCPVC-EVs (15 μg/animal/dose, every 5 days for a total of 3 doses), or vehicle were administrated after 6 weeks of liver fibrosis induction by TAA administration. Animals were euthanized at week 8. Analysis of liver fibrosis by Sirius Red staining: (B) representative photomicrographs of stained liver section (scale bars: 100 mm) and (C) morphometric quantification of collagen deposits. Analysis of in vivo HSC activation by α-SMA immunostaining: (D) representative photomicrographs of stained liver sections (scale bars: 100 mm), and (E) morphometric quantification of α-SMA positive area. Analysis of liver regeneration by PCNA immunostaining: (F) representative photomicrographs of stained liver sections (scale bars: 100 mm), squares show 4× amplified images (with PCNA-positive cells indicated by arrowheads), and (G) PCNA-positive cell quantification (n = 10 for each group). (H,I) Analysis of COL1A2 and α-SMA mRNA levels in liver sample of mice 14 days after first dose of EVs. (J,K) In vitro analysis of COL1A2 and α-SMA mRNA expression on hepatic stellate cells (CFSC-2G cell line) 18 h after incubation with EVs (1 µg/mL). DMEM was used as untreated control. Graph shows average of 3 independent experiments performed in triplicate. Saline/DMEM (white bars), AdGFP-HUCPVC-EVs (gray bars), or AdhIGFI-HUCPVC-EVs (black bars) administration. * p < 0.05; ** λλ p < 0.001; *** p < 0.0005, **** λλλλ p < 0.0001; * vs. saline; λ vs. AdGFP-HUCPVC-EVs; (ANOVA and Tukey’s post-test).
Figure 6
Figure 6
The proteome of EVs derived from HUCPVCs is related with anti-fibrosis potential. (A) Venn diagram of proteins identified by LC-MS/MS on AdhIGF-I-HUCPVC-EVs, AdGFP-HUCPVC-EVs, and HUCPVC-EVs. Volcano plot showing the differential expression analysis between AdhIGF-I-HUCPVC-EVs and HUCPVC-EVs (B), or AdGFP-HUCPVC-EVs (C). Red dots and green dots represent downregulated (p < 0.05, fold change < 0.05) and upregulated (p < 0.05, fold change > 2) proteins respectively. Blue dots represent significative non-regulated proteins (p < 0.05, 0.05 < fold change < 1). Gray dots represents non-significative proteins (p > 0.05). (DF) Gene ontology analysis of co-expressed proteins on AdhIGF-I-HUCPVC-EVs, AdGFP-HUCPVC-EVs, and HUCPVC-EVs. (D,E) show the top 10 of “Molecular Function” and “Biological Function”, respectively. (F) show the “Biological Process” involved in anti-fibrotic pathways. Graph shows number of proteins (right axis, column bars) and Q-value B&H (left axis, dots). FDR, false discovery rate.

References

    1. Lee Y.A., Wallace M.C., Friedman S.L. Pathobiology of liver fibrosis: A translational success story. Gut. 2015;64:830–841. doi: 10.1136/gutjnl-2014-306842. - DOI - PMC - PubMed
    1. Bataller R., Brenner D.A. Liver fibrosis. J. Clin. Investig. 2005;115:209–218. doi: 10.1172/JCI24282. - DOI - PMC - PubMed
    1. Fiore E.J., Dominguez L.M., Bayo J., Garcia M.G., Mazzolini G.D. Taking advantage of the potential of mesenchymal stromal cells in liver regeneration: Cells and extracellular vesicles as therapeutic strategies. World J. Gastroenterol. 2018;24:2427–2440. doi: 10.3748/wjg.v24.i23.2427. - DOI - PMC - PubMed
    1. Fiore E.J., Mazzolini G., Aquino J.B. Mesenchymal Stem/Stromal Cells in Liver Fibrosis: Recent Findings, Old/New Caveats and Future Perspectives. Stem Cell Rev. 2015;11:586–597. doi: 10.1007/s12015-015-9585-9. - DOI - PubMed
    1. Han Y., Li X., Zhang Y., Han Y., Chang F., Ding J. Mesenchymal Stem Cells for Regenerative Medicine. Cells. 2019;8:886. doi: 10.3390/cells8080886. - DOI - PMC - PubMed

LinkOut - more resources