. 2023 Jun 1;24(11):9631.
doi: 10.3390/ijms24119631.

Extracellular Vesicles as Markers of Liver Function: Optimized Workflow for Biomarker Identification in Liver Disease

Affiliations

Extracellular Vesicles as Markers of Liver Function: Optimized Workflow for Biomarker Identification in Liver Disease

Martha Paluschinski et al. Int J Mol Sci. .

Abstract

Liver diseases represent a significant global health burden, necessitating the development of reliable biomarkers for early detection, prognosis, and therapeutic monitoring. Extracellular vesicles (EVs) have emerged as promising candidates for liver disease biomarkers due to their unique cargo composition, stability, and accessibility in various biological fluids. In this study, we present an optimized workflow for the identification of EVs-based biomarkers in liver disease, encompassing EVs isolation, characterization, cargo analysis, and biomarker validation. Here we show that the levels of microRNAs miR-10a, miR-21, miR-142-3p, miR-150, and miR-223 were different among EVs isolated from patients with nonalcoholic fatty liver disease and autoimmune hepatitis. In addition, IL2, IL8, and interferon-gamma were found to be increased in EVs isolated from patients with cholangiocarcinoma compared with healthy controls. By implementing this optimized workflow, researchers and clinicians can improve the identification and utilization of EVs-based biomarkers, ultimately enhancing liver disease diagnosis, prognosis, and personalized treatment strategies.

Keywords: biomarker; cytokine; extracellular vesicles; liver diseases; microRNA; nanoparticle-tracking analysis.


Conflict of interest statement

The authors declare no conflict of interest.

Figures

Figure 1
Figure 1
NTA quantification of EVs in sera of liver-diseased patients. Sera from patients with either NAFLD (n = 24), or AIH (n = 9) or healthy donors (n = 14) were analyzed by NTA. (a) Average particle size as measured by NTA showed a reduced EV size in AIH patients compared with healthy individuals, while quantification of EVs in patients’ sera indicated an increased number of EVs in NAFLD and AIH patients compared with control, respectively. (b,c) Analysis of EVs size distribution and number in the sera of (b) younger (2-months-old) and older (22-months-old) rats (n = 3 and n = 9, respectively) and in the sera of (c) Gunn and control rats (n = 3). Correlations of serum GOT and GPT, with particle average sizes (d) and EV number (e) in NAFLD patients. Statistical analyses were carried out in GraphPad using one-way ANOVA or two tailed unpaired t-tests for comparison of two groups. ns = Not significant; p ≤ 0.05, *; p ≤ 0.01, **; p ≤ 0.0001, ****.
Figure 2
Figure 2
Evaluation of the effect of bilirubin, hemoglobin, and protein aggregates on NTA measurements: (a) Western blot for albumin in rat sera treated with either 500 μg/mL Proteinase K (PTK), 1% Triton X-100 (TX100), or the combination of the two (PTK/TX100) and incubated at 48 °C overnight. Control samples were left untreated (CTRL) or incubated at 48 °C overnight [CTRL(48C)]. The figure shows protein bands with 70 kDa size (integration time 50 s). (b) NTA analysis of the PTK, TX100, PTK/TX100 treated or control sera (n = 6). (c) EVs circulating in sera from Gunn and control (CTRL) rats were analyzed by NTA. EVs concentration (left panel) and size (right panel) in the sera of CTRL and Gunn rats, showing a significant increase of EVs concentration and reduction in EVs size in Gunn compared with CTRL rats (n = 3). To evaluate the potential effects of Bilirubin (Br), NTA measurement in crude rat serum (or plasma), Br was diluted at 0.5 mg/mL [BR(0.5),] and 10 mg/mL [BR(10)] in PBS (see material and method section) and measured by NTA. No signal was detected by NTA in Br solutions. (d) To evaluate the potential effects of hemolysis of NTA, hemoglobin (Hb) was diluted in PBS to simulate 0.5% and 5% hemolysis (see material and method), and measured by NTA. Data are shown as average ± standard deviation (n = 5), statistical analyses were carried out in GraphPad using one-way. N.D. = Not detectable; p ≤ 0.001, ***.
Figure 3
Figure 3
PEG-isolated EVs are enriched in exosomal markers. (a) Quantification of serum protein carry-over. TEI precipitation resulted in 0.61% (±0.161, n = 3), whereas PEG (4%) resulted in 1.04% (±0.466, n = 3) carry-over of serum albumin in the pellets (PEL) (n = 3). (Top panel) after 1 cycle of precipitation about 1% albumin was still detectable in the EVs-enriched pellet. (b) The exosomal markers TSG101 was exclusively detected in the EVs enriched pellets (PLT), on the other hand, (c) albumin was mainly detected in the EVs-enriched pellet (SN). Statistical analyses were carried out in GraphPad using two tailed unpaired t-tests for comparison of two groups. p ≤ 0.01, **; p ≤ 0.0001, ****.
Figure 4
Figure 4
Evaluation of extracellular vesicles integrity and functionality: (a) Fluorescently labeled particles of defined size (100 nm, 200 nm and 600 nm), were loaded on the BD FACSAria III flow cytometer (FC), and (b) EVs of 200 nm in size were used to establish of a 200 nm gate. (c) Sera containing Syto RNASelect (FITC-label) labeled EVs were loaded on the FC and the 200 nm gate was used to visualize and quantify the number and fluorescence of Syto RNASelect labeled EVs. (d) Uptake of EVs by hepatocytes is shown by the increase in green fluorescence (middle panel, Syto RNASelect-labeled RNA), the increase in fluorescence is absent from cells incubated with EVs that were digested with PTK. Images acquired by fluorescence microscopy after 24 h incubation. Scale bars 100 μm (e) Quantification of relative fluorescence measured from primary rat hepatocytes following the uptake of EVs containing fluorescently labeled RNAs with or without PTK digestion. Fluorescence was measured before EVs addition (time 0) and every 90 min for five times. Data are represent as average fluorescence ± SD (n = 8), only significant differences are shown. Statistical analyses were carried out in GraphPad using one-way ANOVA. p ≤ 0.05, *; p ≤ 0.01, **; p ≤ 0.001, ***.
Figure 5
Figure 5
Analysis of miRNA expression in EVs isolated from patients with liver diseases and aged animals: (a) Electropherograms of RNAs isolated from EV-enriched pellets and EV-depleted supernatants display distinctly different RNA profiles. The blue (EVs enriched RNAs) and green (Evs depleted RNAs) arrows show the location of the RNA peaks on the electropherograms. (b) miQPCR was used to quantify the levels of miRNAs isolated from EVs-enriched pellets from liver-diseased patients. EVs were isolated from the sera of NAFLD patients (n = 11), AIH patients (n = 7) and healthy donors (CTRL; n = 11). (b upper panel) The expression of seven miRNAs was found significantly increased in both AIH and NAFLD vs. CTRL. (b middle panel) miR-142-3p, -10a and -223 expression was found to be significantly elevated in AIH vs. CTRL. (b lower panel) miR-150, -15a and -21 expression was found to be significantly elevated in AIH vs. NAFLD. (c) Heat map representation of the data shown in panel b. (d) Analysis of selected miRNAs in EVs isolated from the sera of young (2-months-old, n = 3) and old (22-months-old n = 9) rats. Data are represent as average ± SD. Statistical analyses were carried out in GraphPad using one-way ANOVA and two tailed unpaired t-tests for comparison of two groups. p ≤ 0.05, *; p ≤ 0.01, **; p ≤ 0.001, ***; p ≤ 0.0001, ****.
Figure 6
Figure 6
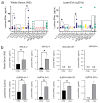
Luminex-based measurement of cytokines in EV-enriched pellets and EVs-depleted supernatants: (a) Quantification of cytokines in sera from the CCA cohort and healthy controls (CTRL) by 8plex Luminex in whole sera (WS, left panel) and in lysed EVs (LEVs, right panel). (b) Side by side representation of the levels of the selected cytokines in WS (top panel) and LEVs (lower panel). Statistical analyses were carried out in GraphPad using two tailed unpaired t-tests for comparison of two groups. ns = Not significant; N.D.= Not Detectable; p ≤ 0.05, *.

References

    1. Pitt J.M., Kroemer G., Zitvogel L. Extracellular vesicles: Masters of intercellular communication and potential clinical interventions. J. Clin. Investig. 2016;126:1139–1143. doi: 10.1172/JCI87316. - DOI - PMC - PubMed
    1. Murphy D.E., de Jong O.G., Brouwer M., Wood M.J., Lavieu G., Schiffelers R.M., Vader P. Extracellular vesicle-based therapeutics: Natural versus engineered targeting and trafficking. Exp. Mol. Med. 2019;51:1–12. doi: 10.1038/s12276-019-0223-5. - DOI - PMC - PubMed
    1. Doyle L.M., Wang M.Z. Overview of Extracellular Vesicles, Their Origin, Composition, Purpose, and Methods for Exosome Isolation and Analysis. Cells. 2019;8:727. doi: 10.3390/cells8070727. - DOI - PMC - PubMed
    1. Yanez-Mo M., Siljander P.R., Andreu Z., Zavec A.B., Borras F.E., Buzas E.I., Buzas K., Casal E., Cappello F., Carvalho J., et al. Biological properties of extracellular vesicles and their physiological functions. J. Extracell. Vesicles. 2015;4:27066. doi: 10.3402/jev.v4.27066. - DOI - PMC - PubMed
    1. Zaborowski M.P., Balaj L., Breakefield X.O., Lai C.P. Extracellular Vesicles: Composition, Biological Relevance, and Methods of Study. Bioscience. 2015;65:783–797. doi: 10.1093/biosci/biv084. - DOI - PMC - PubMed