. 2023 Jun 2;24(11):9679.
doi: 10.3390/ijms24119679.

IGFBP7 Fuels the Glycolytic Metabolism in B-Cell Precursor Acute Lymphoblastic Leukemia by Sustaining Activation of the IGF1R-Akt-GLUT1 Axis

Affiliations

IGFBP7 Fuels the Glycolytic Metabolism in B-Cell Precursor Acute Lymphoblastic Leukemia by Sustaining Activation of the IGF1R-Akt-GLUT1 Axis

Leonardo Luís Artico et al. Int J Mol Sci. .

Abstract

Increased glycolytic metabolism plays an important role in B-cell precursor Acute Lymphoblastic Leukemia (BCP-ALL). We previously showed that IGFBP7 exerts mitogenic and prosuvival effects in ALL by promoting IGF1 receptor (IGF1R) permanence on the cell surface, thus prolonging Akt activation upon IGFs/insulin stimulation. Here, we show that sustained activation of the IGF1R-PI3K-Akt axis concurs with GLUT1 upregulation, which enhances energy metabolism and increases glycolytic metabolism in BCP-ALL. IGFBP7 neutralization with a monoclonal antibody or the pharmacological inhibition of the PI3K-Akt pathway was shown to abrogate this effect, restoring the physiological levels of GLUT1 on the cell surface. The metabolic effect described here may offer an additional mechanistic explanation for the strong negative impact seen in ALL cells in vitro and in vivo after the knockdown or antibody neutralization of IGFBP7, while reinforcing the notion that it is a valid target for future therapeutic interventions.

Keywords: Acute Lymphoblastic Leukemia; GLUT1; IGF1R; IGFBP7; PI3K–Akt.


Conflict of interest statement

The authors declare no conflict of interest.

Figures
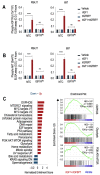
Figure 1
Figure 1
IGFBP7 sustains activation of the IGF1R/Akt axis under IGF1 stimulation in an IGF1R-dependent manner in BCP-ALL cells. (A,B) ELISA results for (A) phospho-IGF1Rβ (Tyr1131) and (B) phospho-Akt (Ser473) in RS4;11 and 697 BCP-ALL cell lines (no target control (NTC) and IGF1R knockout) after 4 h of treatment with rIGF1 (50 ng/mL) and/or rIGFBP7 (100 ng/mL). Bars represent means ± SEM for four independent experiments; ns = not significant. (C) Left: GSEA analysis results. Statistically significant hallmark gene sets were selected (FDR < 0.25) and distributed by the Normalized Enrichment Score (NES). Red bars indicate upregulated hallmark gene sets in BCP-ALL cell lines after 6 h stimulation with rIGF1+rIGFBP7 (50 ng/mL and 100 ng/mL, respectively) in serum-free medium. Blue bars indicate downregulated hallmark gene sets. Right: GSEA enrichment plots for selected hallmarks. Green curve corresponds to the enrichment score (ES). The normalized enrichment score (NES) represents the strength of the relationship between phenotype and gene signature. Bars represent means ± SEM for three independent experiments. Statistical analyses were completed by 2-way ANOVA and Bonferroni post-tests (**** p ≤ 0.0001).
Figure 2
Figure 2
IGFBP7 enhances the energy metabolic parameters of BCP-ALL cells after IGF1 stimulation. Oxygen consumption rate (OCR) traces in 697 and RS4;11 cell lines after 4 h of treatment with rIGF1+rIGFBP7 (50 ng/mL and 100 ng/mL, respectively) or control (vehicle). (A) Arrows indicate sequential injections of CCCP (total amount of 1.2 µM) to reach maximal OCR in 697 cells. (B) Arrows indicate oligomycin (Oligo, 1 μg/mL) and antimycin+rotenone (AA/Rot, 1 μM each) injections to evaluate fractions of OCR linked to ATP synthesis and non-mitochondrial OCR, respectively, in 697 cells. (C) OCR rates (basal, maximal, and linked to ATP synthesis) in 697 cell line. Bars or curves represent means ± SEM for three independent experiments. (D) Representative extracellular acidification rate (ECAR) traces in 697 cell line after 4 h of treatment with rIGF1+rIGFBP7 (50 ng/mL and 100 ng/mL, respectively) or control (vehicle). Arrows indicate glucose (Glu, 10 mM), antimycin+rotenone (AA/Rot, 1 μM each) and monensin+CCCP (Mon, 200 μM; CCCP, 1 μM) injections. (E) Individual ECAR rates in 697 cell line (basal (+glucose), maximal (Mon+CCCP), and glucose uptake (basal with glucose—basal without glucose)). Bars represent means ± SEM for three independent experiments. (F) OCR rates (basal, maximal, and linked to ATP synthesis) in the RS4;11 cell line. Bars or curves represent means ± SEM for four independent experiments. (G) Individual ECAR rates in the RS4;11 cell line (basal (+glucose), maximal (Mon+CCCP), and glucose uptake (basal with glucose—basal without glucose)). Bars represent means ± SEM for four independent experiments. Statistical analyses were completed by unpaired t-test (* p ≤ 0.05).
Figure 3
Figure 3
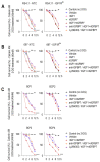
IGFBP7 potentiates glucose uptake in BCP-ALL in an IGF1-, IGF1R-, and PI3K-dependent manner, as evaluated by the 2-DG induced cell death assay. (AC) Calcein AM cell viability assay in (A) RS4;11 and (B) 697 BCP-ALL cell lines (no target control (NTC) and IGF1R knockout) and (C) primary BCP-ALL cells. Except for the control (no 2-DG; black lines), in all other conditions cells were pretreated with rIGF1 (50 ng/mL) and/or rIGFBP7 (100 ng/mL) for 4 h and then subjected to 2-DG treatment (40 mM) for up to 12 h. Where indicated, cells were pretreated with an anti-IGFBP7 antibody (clone C311, 20 µg/mL) or Ly294002 (30 µM), which was added 30 min before rIGF1+rIGFBP7 treatment initiation. Viable cells (Calcein +) were measured by flow cytometry at each indicated time point. Curves represent means ± SEM for three independent experiments. Statistical analyses correspond to differences between areas under the curves (AUC) (* p ≤ 0.05; *** p ≤ 0.001).
Figure 4
Figure 4
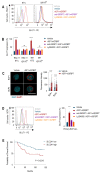
IGFBP7 promotes GLUT1 expression at the cell surface of BCP-ALL in an IGF1-, IGF1R-, and PI3K-dependent manner. (A) GLUT1 cell surface expression obtained by flow cytometry in the RS4;11 and 697 BCP-ALL cell lines (no target control (NTC) and IGF1R knockout) after 24 h of treatment with rIGF1+rIGFBP7 (50 ng/mL and 100 ng/mL, respectively) or control (vehicle). Where indicated, cells were pretreated with an anti-IGFBP7 antibody (clone C311, 20 µg/mL) or Ly294002 (30 µM), which was added 30 min before rIGF1+rIGFBP7. (B) Normalized results of GLUT1 surface expression from three independent experiments. Bars represent means ± SEM; ns = not significant. (C) Confocal analysis of GLUT1 expression in two primary BCP-ALL (BCP1 and 3) samples collected 24 h after treatment with rIGF1+rIGFBP7 (50 ng/mL and 100 ng/mL, respectively) or control (vehicle). Scale bar: 10 μm. Bars represent means ± SEM of the fluorescence intensity of individual cells (symbols). (D) GLUT1 cell surface expression obtained by flow cytometry in primary BCP-ALL cells treated for 24 h with rIGF1+rIGFBP7 (50 ng/mL and 100 ng/mL, respectively) or control (vehicle). Where indicated, cells were pretreated with an anti-IGFBP7 antibody (clone C311, 20 µg/mL) or Ly294002 (30 µM), which was added 30 min before rIGF1+rIGFBP7. Left: GLUT1 cell surface expression in a representative case (BCP1). Right: normalized results for GLUT1 cell surface expression for four different primary BCP-ALL samples. (E) Kaplan–Meier survival curves generated by the cBioPortal (http://www.cbioportal.org (accessed on 15 February 2023)). Overall survival curves of BCP-ALL patients according to low (n = 40) versus high (n = 41) SLC2A1 expression. Curves were compared by the log-rank test. Bars represent means ± SEM. Differences were compared by 1- or 2-way ANOVA and Bonferroni post-tests (*** p ≤ 0.001; **** p ≤ 0.0001).
Figure 5
Figure 5
Schematic diagram illustrating the proposed mechanism by which IGFBP7 stimulates the glycolytic metabolism of ALL. In presence of IGFBP7, IGF1R remains active on the cell surface and sustains the activation of the PI3K–Akt pathway for a longer time. Active Akt blocks GLUT1 endocytosis/recycling, thus resulting in more GLUT1 at the cell surface and in increased glucose transport to fuel the glycolytic metabolism. IGFBP7 neutralization with a monoclonal antibody or the pharmacological inhibition of PI3K–Akt pathway was shown to abrogate this effect, restoring the physiological levels of GLUT1 on the cell surface. The mechanism by which IGFBP7 retains IGF1R at the cell surface is not known. Figure created with BioRender.com.

References

    1. Inaba H., Mullighan C.G. Pediatric acute lymphoblastic leukemia. Haematologica. 2020;105:2524–2539. doi: 10.3324/haematol.2020.247031. - DOI - PMC - PubMed
    1. Greaves M. A causal mechanism for childhood acute lymphoblastic leukaemia. Nat. Rev. Cancer. 2018;18:471–484. doi: 10.1038/s41568-018-0015-6. - DOI - PMC - PubMed
    1. Hunger S.P., Mullighan C.G. Acute Lymphoblastic Leukemia in Children. N. Engl. J. Med. 2015;373:1541–1552. doi: 10.1056/NEJMra1400972. - DOI - PubMed
    1. Maule M., Scélo G., Pastore G., Brennan P., Hemminki K., Tracey E., Sankila R., Weiderpass E., Olsen J.H., McBride M.L., et al. Risk of second malignant neoplasms after childhood leukemia and lymphoma: An international study. J. Natl. Cancer Inst. 2007;99:790–800. doi: 10.1093/jnci/djk180. - DOI - PubMed
    1. Yavvari S., Makena Y., Sukhavasi S., Makena M.R. Large Population Analysis of Secondary Cancers in Pediatric Leukemia Survivors. Children. 2019;6:130. doi: 10.3390/children6120130. - DOI - PMC - PubMed

MeSH terms

Substances

LinkOut - more resources