. 2023 Jun 2;24(11):9692.
doi: 10.3390/ijms24119692.

The Combination of a Human Biomimetic Liver Microphysiology System with BIOLOGXsym, a Quantitative Systems Toxicology (QST) Modeling Platform for Macromolecules, Provides Mechanistic Understanding of Tocilizumab- and GGF2-Induced Liver Injury

Affiliations

The Combination of a Human Biomimetic Liver Microphysiology System with BIOLOGXsym, a Quantitative Systems Toxicology (QST) Modeling Platform for Macromolecules, Provides Mechanistic Understanding of Tocilizumab- and GGF2-Induced Liver Injury

James J Beaudoin et al. Int J Mol Sci. .

Abstract

Biologics address a range of unmet clinical needs, but the occurrence of biologics-induced liver injury remains a major challenge. Development of cimaglermin alfa (GGF2) was terminated due to transient elevations in serum aminotransferases and total bilirubin. Tocilizumab has been reported to induce transient aminotransferase elevations, requiring frequent monitoring. To evaluate the clinical risk of biologics-induced liver injury, a novel quantitative systems toxicology modeling platform, BIOLOGXsym™, representing relevant liver biochemistry and the mechanistic effects of biologics on liver pathophysiology, was developed in conjunction with clinically relevant data from a human biomimetic liver microphysiology system. Phenotypic and mechanistic toxicity data and metabolomics analysis from the Liver Acinus Microphysiology System showed that tocilizumab and GGF2 increased high mobility group box 1, indicating hepatic injury and stress. Tocilizumab exposure was associated with increased oxidative stress and extracellular/tissue remodeling, and GGF2 decreased bile acid secretion. BIOLOGXsym simulations, leveraging the in vivo exposure predicted by physiologically-based pharmacokinetic modeling and mechanistic toxicity data from the Liver Acinus Microphysiology System, reproduced the clinically observed liver signals of tocilizumab and GGF2, demonstrating that mechanistic toxicity data from microphysiology systems can be successfully integrated into a quantitative systems toxicology model to identify liabilities of biologics-induced liver injury and provide mechanistic insights into observed liver safety signals.

Keywords: hepatotoxicity; human liver microphysiology system; macromolecule; quantitative systems toxicology (QST) modeling.


Conflict of interest statement

James J. Beaudoin, Lara Clemens, Christina Battista, Lisl K. M. Shoda, Scott Q. Siler, Brett A. Howell, and Kyunghee Yang are employees of Simulations Plus Inc., which received a National Institutes of Health Small Business Innovation Research Award in collaboration with the University of Pittsburgh Drug Discovery Institute to develop a quantitative systems toxicology platform to predict biologics-induced liver injury. Fatima Zaidi, Priya Ramamoorthy, Kari Wong, Rangaprasad Sarangarajan are employees of Metabolon Inc., which provided in-kind support for metabolomics analysis.

Figures
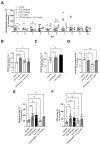
Figure 1
Figure 1
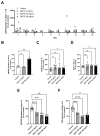
Significant toxicity findings in LAMPS chips treated with tocilizumab (232 µg/mL and 725 µg/mL), IL-6 (3 ng/mL), or a combination of tocilizumab (232 µg/mL) and IL-6 (3 ng/mL). (A) LDH on days 1–10, (B) HMGB1 on day 3, (C) HMGB1 on day 10, (D) CYP3A4-mediated formation of fexofenadine from terfenadine on day 7, (E) steatosis, as measured by LipidTox, on day 10, and (F) ROS, as measured by dihydroethidium, on day 10. n = 15, 14, 6, 6, and 5 chips for control, 232 µg/mL tocilizumab, 725 µg/mL tocilizumab, IL-6, and tocilizumab + IL-6 groups, respectively. Most endpoints were measured for a subset of chips tested. Values presented as mean ± SD. Statistical significance is indicated by asterisks; * < 0.05, ** < 0.01, **** < 0.0001. ns, not significant. CYP, cytochrome P450; HMGB1, high mobility group box 1; IL-6, interleukin-6; LAMPS, Liver Acinus MicroPhysiology System; LDH, lactate dehydrogenase; ROS, reactive oxygen species; TCZ, tocilizumab.
Figure 2
Figure 2
Statistical heat map, pathway diagram, and boxplots of select metabolites associated with oxidative stress within the spent media from the LAMPS models. Within the heatmap, trending (0.05 < p < 0.10) and significant (p ≤ 0.05) elevations are indicated by pink and red, respectively, while trending and significant reductions are represented by light blue and dark blue, respectively. * The compound’s chemical identity was confirmed by its chromatographic and spectral characteristics (RT and molecular fragmentation pattern) and mass, but not based on an authentic chemical standard for the metabolite. Box plots were used to demonstrate the distribution profile of a metabolite where the spread of the data with the middle 50% of the data represented by the box and the whiskers reporting the range of the data. The solid bar across the box represents the median value of that metabolite while the + represents the mean. Data are scaled such that the median value measured across all samples was set to 1.0.
Figure 2
Figure 2
Statistical heat map, pathway diagram, and boxplots of select metabolites associated with oxidative stress within the spent media from the LAMPS models. Within the heatmap, trending (0.05 < p < 0.10) and significant (p ≤ 0.05) elevations are indicated by pink and red, respectively, while trending and significant reductions are represented by light blue and dark blue, respectively. * The compound’s chemical identity was confirmed by its chromatographic and spectral characteristics (RT and molecular fragmentation pattern) and mass, but not based on an authentic chemical standard for the metabolite. Box plots were used to demonstrate the distribution profile of a metabolite where the spread of the data with the middle 50% of the data represented by the box and the whiskers reporting the range of the data. The solid bar across the box represents the median value of that metabolite while the + represents the mean. Data are scaled such that the median value measured across all samples was set to 1.0.
Figure 3
Figure 3
Significant toxicity findings in LAMPS chips treated with GGF2 at 10, 100, and 382 ng/mL. (A) LDH on days 1–10, (B) HMGB1 on day 3, (C) steatosis on day 10, (D) ROS on day 10, (E) glycochenodeoxycholic acid on days 4–6, and (F) taurocholic acid release on days 4–6. n = 15, 11, 6, and 5 chips for control, 10 ng/mL, 100 ng/mL, and 382 ng/mL groups, respectively. Some endpoints were measured for a subset of chips tested. Values presented as mean ± SD. Statistical significance is indicated by asterisks; * < 0.05, ** < 0.01, *** < 0.001, **** < 0.0001. ns, not significant. GCDCA, glycochenodeoxycholic acid; HMGB1, high mobility group box 1; LAMPS, Liver Acinus MicroPhysiology System; LDH, lactate dehydrogenase; ROS, reactive oxygen species; TCA, taurocholic acid.
Figure 4
Figure 4
In-vitro-like simulations of tocilizumab mimicking LAMPS experiments. GastroPlus® PBPK modeling of tocilizumab was used to simulate steady-state plasma concentrations that match the dosing concentrations of tocilizumab in the LAMPS experiments ((A): 232 µg/mL; (D): 725 µg/mL) to subsequently predict the corresponding hepatic interstitial concentrations. Hepatic interstitial concentrations were used to drive the steatosis (B,E) and ROS accumulation (C,F) parameterization in BIOLOGXsym. Red profiles represent simulated profiles in BIOLOGXsym, whereas solid black circles with error bars represent the LAMPS data (mean ± SD). LAMPS, Liver Acinus MicroPhysiology System; PBPK, physiologically based pharmacokinetic; ROS, reactive oxygen species; TCZ, tocilizumab.
Figure 5
Figure 5
Simulated peak ALT responses in the SimCohorts (n = 4) administered (A) tocilizumab alone (8 mg/kg IV given every 4 weeks for 12 weeks), (B) acetaminophen alone (1 g four times a day (4 g/day), 12 weeks), tocilizumab alone (8 mg/kg IV given every 4 weeks for 12 weeks), or acetaminophen + tocilizumab. The impact of the tocilizumab-mediated inhibition of explicitly modeled IL-6 signaling and tocilizumab-mediated steatosis and ROS elevations was explored for tocilizumab alone and acetaminophen + tocilizumab simulations. Each symbol represents each simulated individual; symbol color corresponds to same individual. Dotted horizontal lines indicate ULN multiples (1×, 3× and 5×) of peak ALT, with ALT ULN defined as 40 U/L. ALT, alanine aminotransferase; APAP, acetaminophen; IL-6, interleukin-6; TCZ, tocilizumab; ULN, upper limit of normal.
Figure 6
Figure 6
In-vitro-like simulations of GGF2-mimicking LAMPS experiments. GastroPlus PBPK modeling of GGF2 was used to simulate steady-state plasma concentrations that match the dosing concentrations of GGF2 in the LAMPS experiments ((A): 10 ng/mL; (C): 100 ng/mL; (E): 382 ng/mL) to subsequently predict the corresponding hepatic interstitial concentrations. Hepatic interstitial concentrations were used to drive the mechanisms underlying altered bile acid secretion (B,D,F) parameterization in BIOLOGXsym. Red solid circles with error bars represent simulated values (mean ± SD) in BIOLOGXsym on days 4, 5 and 6, whereas solid black circles with error bars represent the LAMPS data (mean ± SD) on these days. GCDCA, glycochenodeoxycholic acid; TCA, taurocholic acid; BAs, bile acids.
Figure 7
Figure 7
Sensitivity analysis of GGF2 effects on bilirubin and bile acid disposition-related mechanisms in the baseline human. Red and green arrows in the headers indicate down- or upregulation of the respective pathway based on transcriptional data [4]. The default toxicity parameter values across all panels are based on the magnitude of GGF2 impact on each individual mechanism using the transcriptional data and were subsequently decreased or increased as indicated in the color-coded legend. ALT, alanine aminotransferase; ATP, adenosine triphosphate; CDCA, chenodeoxycholic acid; CL, centrilobular; TB, total bilirubin.
Figure 8
Figure 8
Comparison of simulated (red lines) and observed (black symbols and lines) GGF2-mediated hepatic responses. Solid red lines represent plasma ALT and total bilirubin simulation results in the SimCohorts (n = 16). Plasma total bilirubin simulation results in the baseline human with varying magnitudes of GGF2 effects on bilirubin transporters are also presented to account for to account for uncertainty around transcriptional data. ALT, alanine aminotransferase; TB, total bilirubin.

References

    1. FDA . What Are “Biologics” Questions and Answers. US FDA; Silver Spring, MD, USA: 2018.
    1. Opportunities and Challenges in Biologic Drug Delivery. 2017. [(accessed on 4 March 2020)]. Available online: http://www.americanpharmaceuticalreview.com/Featured-Articles/345540-Opp...
    1. Shah P., Sundaram V., Björnsson E. Biologic and Checkpoint Inhibitor-Induced Liver Injury: A Systematic Literature Review. Hepatol. Commun. 2020;4:172–184. doi: 10.1002/hep4.1465. - DOI - PMC - PubMed
    1. Mosedale M., Button D., Jackson J.P., Freeman K.M., Brouwer K.R., Caggiano A.O., Eisen A., Iaci J.F., Parry T.J., Stanulis R., et al. Transient Changes in Hepatic Physiology That Alter Bilirubin and Bile Acid Transport May Explain Elevations in Liver Chemistries Observed in Clinical Trials of GGF2 (Cimaglermin Alfa) Toxicol. Sci. 2018;161:401–411. doi: 10.1093/toxsci/kfx222. - DOI - PubMed
    1. Longo D.M., Generaux G.T., Howell B.A., Siler S.Q., Antoine D.J., Button D., Caggiano A., Eisen A., Iaci J., Stanulis R., et al. Refining Liver Safety Risk Assessment: Application of Mechanistic Modeling and Serum Biomarkers to Cimaglermin Alfa (GGF2) Clinical Trials. Clin. Pharmacol. Ther. 2017;102:961–969. doi: 10.1002/cpt.711. - DOI - PMC - PubMed

MeSH terms