. 2023 Jun 2;24(11):9696.
doi: 10.3390/ijms24119696.

SPINK2 Protein Expression Is an Independent Adverse Prognostic Marker in AML and Is Potentially Implicated in the Regulation of Ferroptosis and Immune Response

Affiliations

SPINK2 Protein Expression Is an Independent Adverse Prognostic Marker in AML and Is Potentially Implicated in the Regulation of Ferroptosis and Immune Response

Herbert Augustus Pitts et al. Int J Mol Sci. .

Abstract

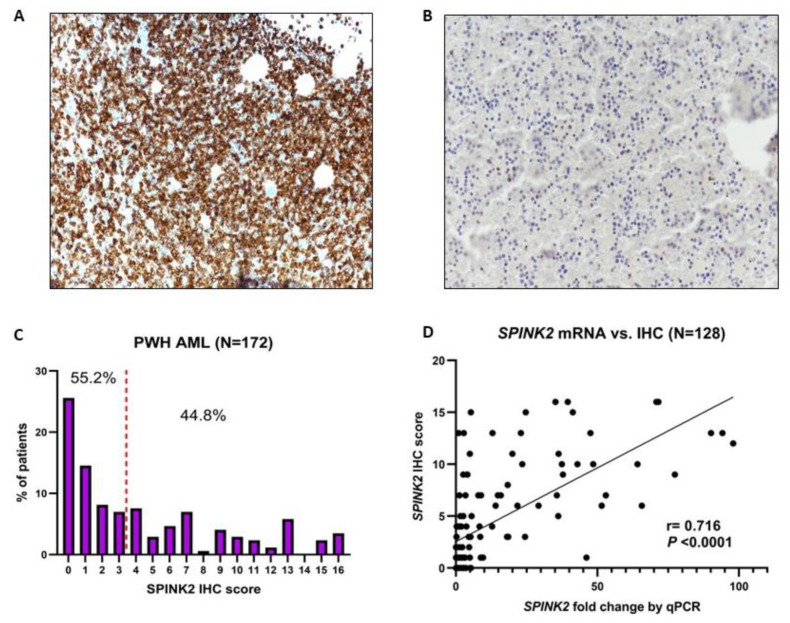
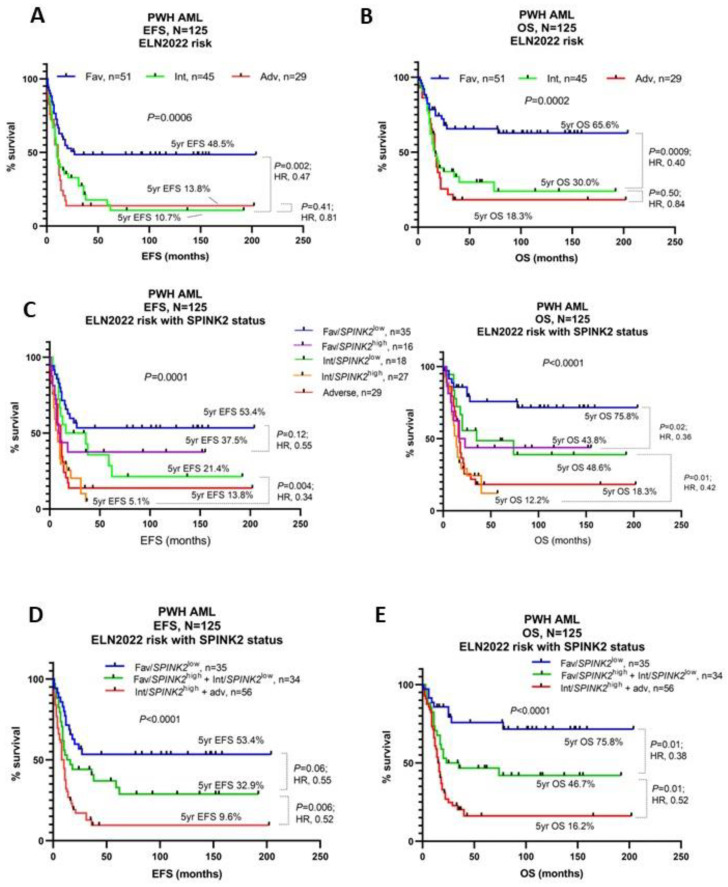
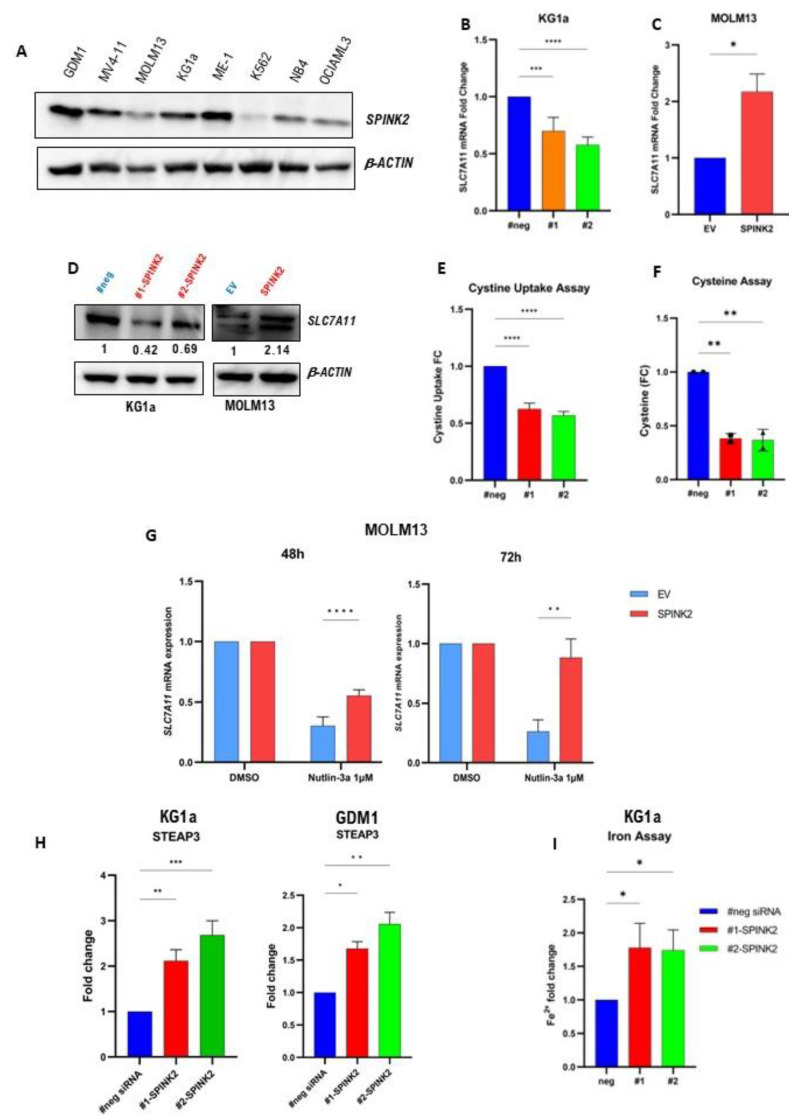
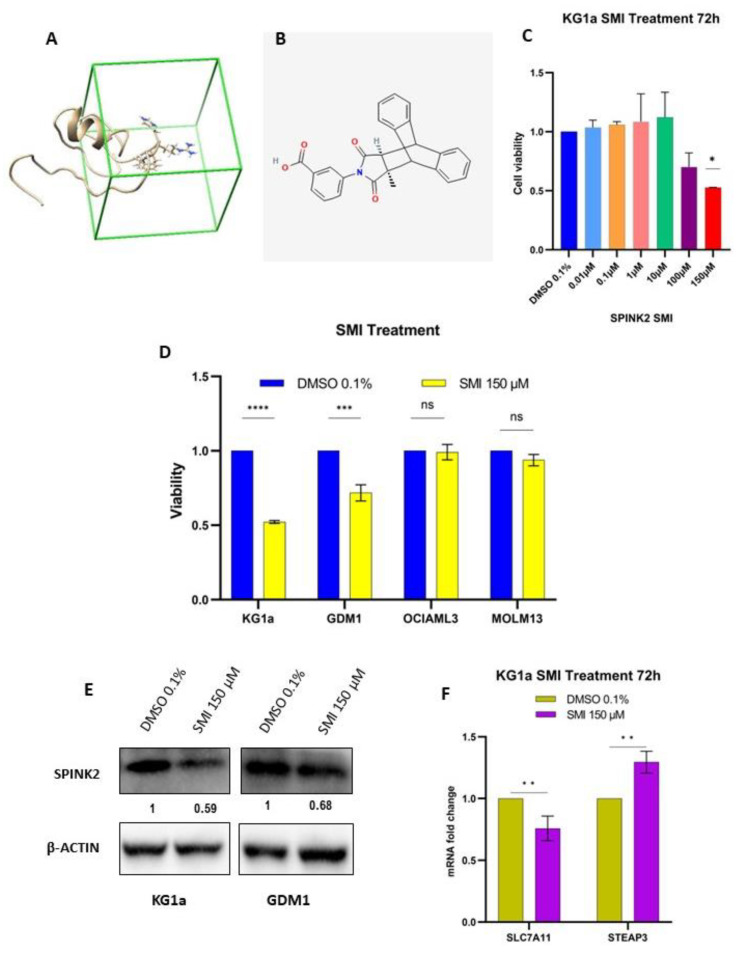
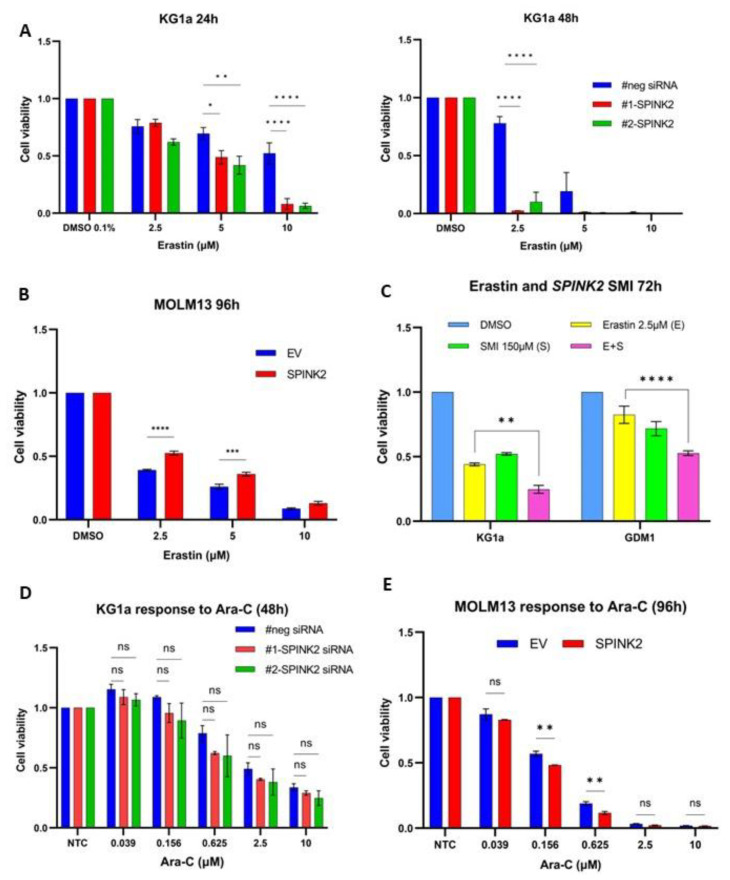
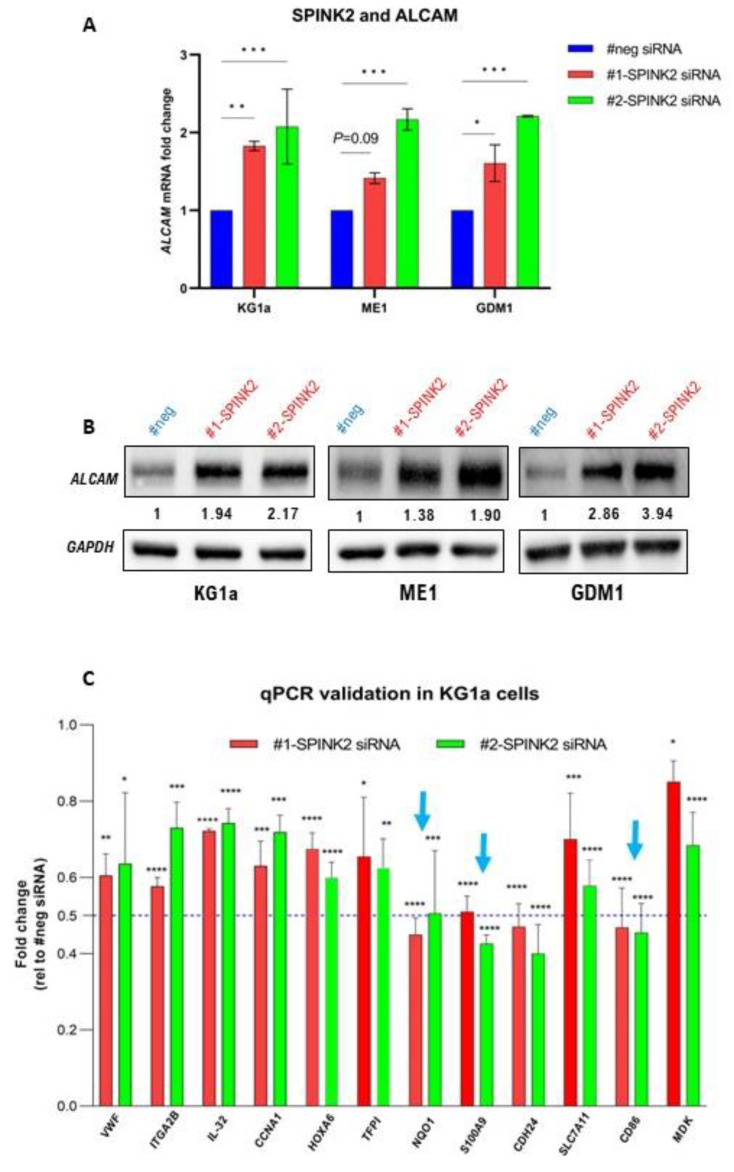
There is an urgent need for the identification as well as clinicopathological and functional characterization of potent prognostic biomarkers and therapeutic targets in acute myeloid leukemia (AML). Using immunohistochemistry and next-generation sequencing, we investigated the protein expression as well as clinicopathological and prognostic associations of serine protease inhibitor Kazal type 2 (SPINK2) in AML and examined its potential biological functions. High SPINK2 protein expression was an independent adverse biomarker for survival and an indicator of elevated therapy resistance and relapse risk. SPINK2 expression was associated with AML with an NPM1 mutation and an intermediate risk by cytogenetics and European LeukemiaNet (ELN) 2022 criteria. Furthermore, SPINK2 expression could refine the ELN2022prognostic stratification. Functionally, an RNA sequencing analysis uncovered a potential link of SPINK2 with ferroptosis and immune response. SPINK2 regulated the expression of certain P53 targets and ferroptosis-related genes, including SLC7A11 and STEAP3, and affected cystine uptake, intracellular iron levels and sensitivity to erastin, a specific ferroptosis inducer. Furthermore, SPINK2 inhibition consistently increased the expression of ALCAM, an immune response enhancer and promoter of T-cell activity. Additionally, we identified a potential small-molecule inhibitor of SPINK2, which requires further characterization. In summary, high SPINK2 protein expression was a potent adverse prognostic marker in AML and might represent a druggable target.

Keywords: acute myeloid leukemia; ferroptosis; immune response; leukemic stem cells; prognosis.


Conflict of interest statement

The authors declare no conflict of interest.

Figures

Figure 1
Figure 1
SPINK2 IHC staining and expression in adult AML. (A,B) Representative IHC images with SPINK2 staining with a dilution of 1:100 showing strong (A) expression and low/absent (B) expression. Images were captured using a Nikon Eclipse Ni DS-Ri2 Microscope (Nikon Instruments, Inc.) at 20× magnification using the NIS software. (C) Histogram showing the SPINK2 IHC score distribution among 172 adult AML patients of the PWH cohort. The height of the purple bars denotes the percentage of patients having a particular score from 0 to 16. A score of 3 was the median (red dashed vertical line). (D) Strong positive correlation between SPINK2 IHC score and mRNA fold change by qPCR in a subset of 128 patients.
Figure 2
Figure 2
Prognostic refinement of ELN2022 risk with SPINK2 IHC status. (A,B) Kaplan–Meier (KM) survival curves for EFS (A) and OS (B) based upon ELN2022 risk only. (C) KM curves for EFS (left) and OS (right) based upon ELN2022 risk with incorporation of SPINK2 IHC status. (D,E) KM curves for EFS (D) and OS (E) based upon ELN2022 risk with incorporation of SPINK2 IHC status and combination of indicated categories. Survival proportions were compared using the logrank p-value and logrank hazard ratio (HR). Abbreviations: Fav, favorable risk; Int, intermediate risk; Adv, adverse risk.
Figure 3
Figure 3
Transcriptome analysis reveals potential link between SPINK2 and ferroptosis-related genes. (A) Western blot showing the protein expression of SPINK2 in various AML cell lines. β-ACTIN was used as loading control. (B) SLC7A11 mRNA expression by qPCR in KG1a negative-control siRNA (#neg) and SPINK2 knockdown with 2 siRNAs (#1 and #2). Statistics: one-way ANOVA with Dunnett’s multiple comparisons test. Mean ± SD of four independent experiments is shown. (C) SLC7A11 mRNA expression by qPCR in MOLM13 empty vector (EV) and SPINK2-overexpressing cells. Statistics: unpaired t-test. Mean ± SD of two independent experiments is shown. (D) Western blot showing SLC7A11 expression upon SPINK2 knockdown in KG1a cells and SPINK2 overexpression in MOLM13 cells. The numbers denote the relative protein expression normalized to the loading control. β-ACTIN was used as loading control. (E) Cystine uptake assay in KG1a cells. Cystine uptake in SPINK2-KD cells vs. negative control, in which cystine uptake in negative control was set to a value of 1. Statistics: one-way ANOVA with Dunnett’s multiple comparisons test. Mean ± SD of three independent experiments is shown. (F) Intracellular cysteine assay in KG1a cells comparing cysteine levels in SPINK2-KD cells vs. negative control; cysteine level in negative control was set to a value of 1. Statistics: one-way ANOVA with Dunnett’s multiple comparisons test. Mean ± SD of two independent experiments is shown. (G) mRNA expression by qPCR of SLC7A11 in MOLM13 cells treated for 48 h and 72 h with Nutlin-3a. Statistics: one-way ANOVA with Dunnett’s multiple comparisons test. Mean ± SD of two independent experiments is shown. (H) STEAP3 mRNA expression by qPCR in KG1a and GDM1 cells with SPINK2-KD vs. negative control. Statistics: one-way ANOVA with Dunnett’s multiple comparisons test. Mean ± SD of three independent experiments in KG1a; mean ± SD of two independent experiments in GDM1. (I) Iron (Fe2+) assay in KG1a cells with SPINK2-KD vs. negative control; Fe2+ level in negative control was set to a value of 1. Statistics: one-way ANOVA with Dunnett’s multiple comparisons test. Mean ± SD of two independent experiments is shown. For all images: * p < 0.05, ** p < 0.01, *** p < 0.001, **** p < 0.0001.
Figure 4
Figure 4
Identification and in-vitro testing of potential SPINK2 small-molecule inhibitor (SMI). (A) Targeting domain of SPINK2 protein highlighted by the green box. (B) Chemical structure of the potential SPINK2 SMI, C26H19NO4. (C) Cell viability analysis of KG1a cells treated with DMSO 0.1% and increasing doses of SPINK2 SMI for 72 h. Statistics: Ordinary one-way ANOVA with Dunnett’s multiple comparison’s test. Mean ± SD shown for two independent experiments. * p < 0.05. (D) Cell viability analysis of KG1a, GDM1, OCIAML3 and MOLM13 cells treated with SMI for 72 h at 150 µM. (E) Western blot showing SPINK2 expression in KG1a and GDM1 cells after 72 h of SMI 150 µM treatment. The numbers denote the relative protein expression normalized to the loading control, β-ACTIN. (F) qPCR for SLC7A11 and STEAP3 in KG1a cells treated for 72 h with DMSO 0.1% and SMI 150 µM. Statistics: one-way ANOVA with Tukey’s multiple comparisons test. Mean ± SD is shown for three independent experiments. **** p < 0.0001, *** p < 0.001,** p < 0.01, * p < 0.05, ns, not significant.
Figure 5
Figure 5
Effects of modulation of SPINK2 expression on erastin sensitivity. (A) Cell viability analysis of KG1a cells with siRNA knockdown (#neg, #1-SPINK2, #2-SPINK2) treated with DMSO and erastin for 24 h (left) and 48 h (right) at the indicated doses. (B) Cell viability analysis of MOLM13 cells (EV and SPINK2) treated with DMSO and erastin for 96 h at the indicated doses. (C) Cell viability analysis of KG1a wildtype and GDM1 wildtype cells treated with DMSO, erastin and SPINK2-SMI for 72 h at the indicated doses. (D) Cell viability analysis of KG1a cells with siRNA knockdown (#neg, #1-SPINK2, #2-SPINK2) treated with Ara-C for 48 h at the indicated doses. (E) Cell viability analysis of MOLM13 (EV and SPINK2) cells treated with Ara-C for 96 h at the indicated doses. For all images: Statistics: one-way ANOVA with Tukey’s multiple comparisons test; Mean ± SD is shown for at least two independent experiments. ns, not significant, * p < 0.05, ** p < 0.01, *** p < 0.001, **** p < 0.0001.
Figure 6
Figure 6
SPINK2 knockdown modulates expression of immune-response related genes in LSC-like cells. (A) ALCAM mRNA expression by qPCR in KG1a, ME1 and GDM1 cells with negative control siRNA (#neg) and SPINK2 knockdown with 2 siRNAs (#1 and #2). Statistics: one-way ANOVA with Dunnett’s multiple comparison’s test. Mean ± SD is shown for two independent experiments. (B) Western blots showing ALCAM expression in KG1a, ME1 and GDM1 cells with negative control siRNA (#neg) and SPINK2 knockdown with 2 siRNAs. The numbers denote the relative protein expression normalized to the loading control. GAPDH was used as loading control. (C) mRNA expression by qPCR of several genes consistently downregulated by SPINK2 knockdown in KG1a cells. Blue arrows indicate T-cell activity inhibitory genes (NQO1, CD86, S100A9) which were downregulated ≥ two-fold. Statistics: one-way ANOVA with Dunnett’s multiple comparisons test. Mean ± SD is shown for three independent experiments. For all images: * p < 0.05, ** p < 0.01, *** p < 0.001, **** p < 0.0001.

References

    1. Ferrara F., Schiffer C.A. Acute myeloid leukaemia in adults. Lancet. 2013;381:484–495. doi: 10.1016/S0140-6736(12)61727-9. - DOI - PubMed
    1. Estey E.H. Acute myeloid leukemia: 2019 update on risk-stratification and management. Am. J. Hematol. 2018;93:1267–1291. doi: 10.1002/ajh.25214. - DOI - PubMed
    1. Roussel X., Daguindau E., Berceanu A., Desbrosses Y., Warda W., Da Rocha M.N., Trad R., Deconinck E., Deschamps M., Ferrand C. Acute Myeloid Leukemia: From Biology to Clinical Practices Through Development and Pre-Clinical Therapeutics. Front. Oncol. 2020;10:599933. doi: 10.3389/fonc.2020.599933. - DOI - PMC - PubMed
    1. Döhner H., Wei A.H., Appelbaum F.R., Craddock C., DiNardo C.D., Dombret H., Ebert B.L., Fenaux P., Godley L.A., Hasserjian R.P., et al. Diagnosis and management of AML in adults: 2022 recommendations from an international expert panel on behalf of the ELN. Blood. 2022;140:1345–1377. doi: 10.1182/blood.2022016867. - DOI - PubMed
    1. Roloff G.W., Odenike O., Bajel A., Wei A.H., Foley N., Uy G.L. Contemporary Approach to Acute Myeloid Leukemia Therapy in 2022. Am. Soc. Clin. Oncol. Educ. Book. 2022;42:1–16. doi: 10.1200/EDBK_349605. - DOI - PubMed

MeSH terms