

Variation in Vegetation Phenology and Its Response to Climate Change in Marshes of Inner Mongolian
- PMID: 37299051
- PMCID: PMC10255120
- DOI: 10.3390/plants12112072
Variation in Vegetation Phenology and Its Response to Climate Change in Marshes of Inner Mongolian
Abstract
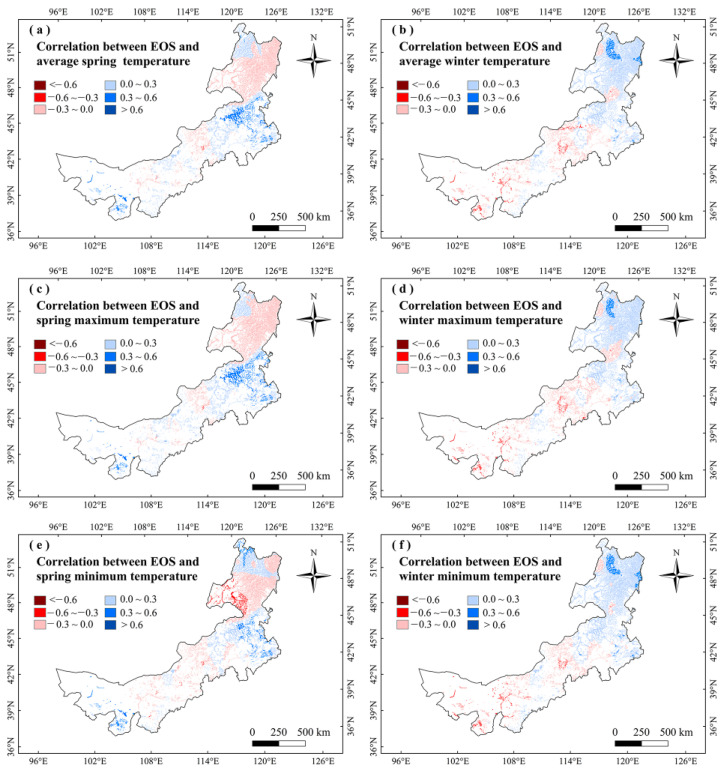
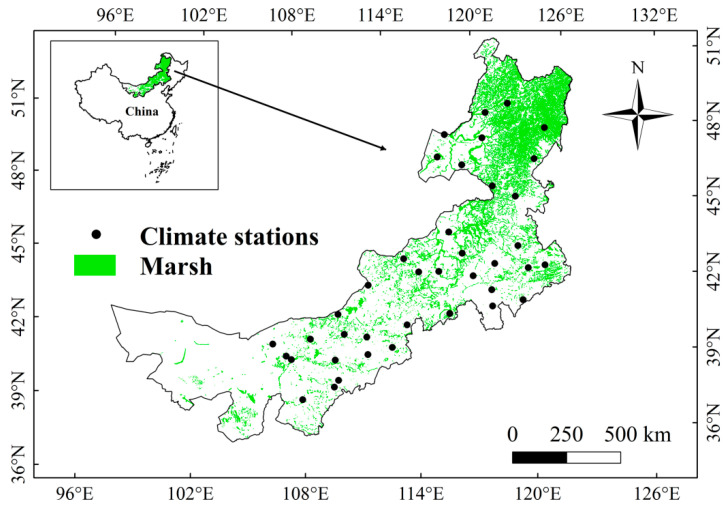
Inner Mongolia has a large area of marsh wetland in China, and the marsh in this region is important for maintaining ecological balance. Understanding variations in vegetation phenology of marsh ecosystems and their responses to climatic change is crucial for vegetation conservation of marsh wetlands in Inner Mongolia. Using the climate and NDVI data during 2001-2020, we explored the spatiotemporal changes in the start (SOS), end (EOS), and length (LOS) of vegetation growing season and analyzed the effects of climate change on vegetation phenology in the Inner Mongolia marshes. Results showed that SOS significantly (p < 0.05) advanced by 0.50 days/year, EOS significantly delayed by 0.38 days/year, and thus LOS considerably increased by 0.88 days/year during 2001-2020 in marshes of Inner Mongolia. Warming temperatures in winter and spring could significantly (p < 0.05) advance the SOS, and increased summer and autumn temperatures could delay EOS in Inner Mongolia marshes. We found for the first time that daytime maximum temperature (Tmax) and night minimum temperature (Tmin) had asymmetric effects on marsh vegetation phenology. Increasing Tmax had a stronger advancing effect on SOS than increasing Tmin from December to April. The increase of Tmin in August could obviously delayed EOS, while increasing Tmax in August had no significant effect on EOS. This study highlights that the asymmetric influences of nighttime and daytime temperatures should be taken into account in simulating marsh vegetation phenology in temperate arid and semi-arid regions worldwide, particularly in the context of global asymmetric diurnal warming.
Keywords: Inner Mongolia; climatic change; marsh; response; vegetation phenology.
Conflict of interest statement
The authors declare no conflict of interest.
Figures


Similar articles
-
Spatiotemporal variation in vegetation phenology and its response to climate change in marshes of Sanjiang Plain, China.Ecol Evol. 2023 Jan 18;13(1):e9755. doi: 10.1002/ece3.9755. eCollection 2023 Jan. Ecol Evol. 2023. PMID: 36699565 Free PMC article.
-
Spatiotemporal variation in vegetation spring phenology and its response to climate change in freshwater marshes of Northeast China.Sci Total Environ. 2019 May 20;666:1169-1177. doi: 10.1016/j.scitotenv.2019.02.265. Epub 2019 Feb 21. Sci Total Environ. 2019. PMID: 30970482
-
Critical role of water conditions in the responses of autumn phenology of marsh wetlands to climate change on the Tibetan Plateau.Glob Chang Biol. 2024 Jan;30(1):e17097. doi: 10.1111/gcb.17097. Glob Chang Biol. 2024. PMID: 38273510
-
Interpretation of vegetation phenology changes using daytime and night-time temperatures across the Yellow River Basin, China.Sci Total Environ. 2019 Nov 25;693:133553. doi: 10.1016/j.scitotenv.2019.07.359. Epub 2019 Jul 23. Sci Total Environ. 2019. PMID: 31374493
-
Impacts of climate change on vegetation phenology and net primary productivity in arid Central Asia.Sci Total Environ. 2021 Nov 20;796:149055. doi: 10.1016/j.scitotenv.2021.149055. Epub 2021 Jul 15. Sci Total Environ. 2021. PMID: 34328878
Cited by
-
Spatial and temporal variation of net primary productivity of herbaceous marshes and its climatic drivers in China.Front Plant Sci. 2024 May 14;15:1380081. doi: 10.3389/fpls.2024.1380081. eCollection 2024. Front Plant Sci. 2024. PMID: 38807779 Free PMC article.
-
Understanding vegetation phenology responses to easily ignored climate factors in china's mid-high latitudes.Sci Rep. 2024 Apr 16;14(1):8773. doi: 10.1038/s41598-024-59336-5. Sci Rep. 2024. PMID: 38627532 Free PMC article.
References
-
- Yang P., Zhang L., Lai D.Y., Yang H., Tan L., Luo L., Tong C., Hong Y., Zhu W., Tang K.W. Landscape Change Affects Soil Organic Carbon Mineralization and Greenhouse Gas Production in Coastal Wetlands. Glob. Biogeochem. Cycles. 2022;36:e2022GB007469. doi: 10.1029/2022GB007469. - DOI
-
- Smith A., Kirwan M. Sea level-driven marsh migration results in rapid net loss of carbon. Geophys. Res. Lett. 2021;48:e2021GL092420. doi: 10.1029/2021GL092420. - DOI
-
- Keppeler F., Olin J., López-Duarte P., Polito M., Hooper-Bùi L., Taylor S., Rabalais N., Fodrie F., Roberts B., Turner R., et al. Body size, trophic position, and the coupling of different energy pathways across a saltmarsh landscape. Limnol. Oceanogr. Lett. 2021;6:360–368. doi: 10.1002/lol2.10212. - DOI
-
- Coleman D., Schuerch M., Temmerman S., Guntenspergen G., Smith C., Kirwan M. Reconciling models and measurements of marsh vulnerability to sea level rise. Limnol. Oceanogr. Lett. 2022;7:140–149. doi: 10.1002/lol2.10230. - DOI
Grants and funding
LinkOut - more resources
Full Text Sources
Miscellaneous
