

Genome-Wide Association Study Identified Candidate Genes for Alkalinity Tolerance in Rice
- PMID: 37299185
- PMCID: PMC10255560
- DOI: 10.3390/plants12112206
Genome-Wide Association Study Identified Candidate Genes for Alkalinity Tolerance in Rice
Abstract
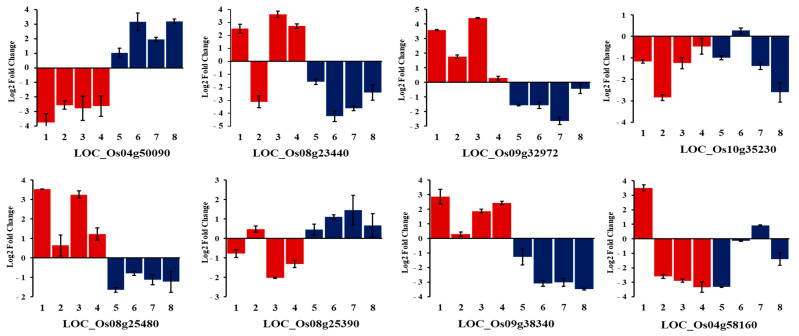
Alkalinity stress is a major hindrance to enhancing rice production globally due to its damaging effect on plants' growth and development compared with salinity stress. However, understanding of the physiological and molecular mechanisms of alkalinity tolerance is limited. Therefore, a panel of indica and japonica rice genotypes was evaluated for alkalinity tolerance at the seedling stage in a genome-wide association study to identify tolerant genotypes and candidate genes. Principal component analysis revealed that traits such as alkalinity tolerance score, shoot dry weight, and shoot fresh weight had the highest contribution to variations in tolerance, while shoot Na+ concentration, shoot Na+:K+ ratio, and root-to-shoot ratio had moderate contributions. Phenotypic clustering and population structure analysis grouped the genotypes into five subgroups. Several salt-susceptible genotypes such as IR29, Cocodrie, and Cheniere placed in the highly tolerant cluster suggesting different underlying tolerance mechanisms for salinity and alkalinity tolerance. Twenty-nine significant SNPs associated with alkalinity tolerance were identified. In addition to three alkalinity tolerance QTLs, qSNK4, qSNC9, and qSKC10, which co-localized with the earlier reported QTLs, a novel QTL, qSNC7, was identified. Six candidate genes that were differentially expressed between tolerant and susceptible genotypes were selected: LOC_Os04g50090 (Helix-loop-helix DNA-binding protein), LOC_Os08g23440 (amino acid permease family protein), LOC_Os09g32972 (MYB protein), LOC_Os08g25480 (Cytochrome P450), LOC_Os08g25390 (Bifunctional homoserine dehydrogenase), and LOC_Os09g38340 (C2H2 zinc finger protein). The genomic and genetic resources such as tolerant genotypes and candidate genes would be valuable for investigating the alkalinity tolerance mechanisms and for marker-assisted pyramiding of the favorable alleles for improving alkalinity tolerance at the seedling stage in rice.
Keywords: Oryza sativa; abiotic stress; alkalinity tolerance; candidate genes; genome-wide association study; seedling stage; single nucleotide polymorphism.
Conflict of interest statement
The authors declare no conflict of interest.
Figures


Similar articles
-
Genome-wide association study and candidate gene analysis of alkalinity tolerance in japonica rice germplasm at the seedling stage.Rice (N Y). 2019 Apr 11;12(1):24. doi: 10.1186/s12284-019-0285-y. Rice (N Y). 2019. PMID: 30976929 Free PMC article.
-
Genetic Dissection of Alkalinity Tolerance at the Seedling Stage in Rice (Oryza sativa) Using a High-Resolution Linkage Map.Plants (Basel). 2022 Dec 2;11(23):3347. doi: 10.3390/plants11233347. Plants (Basel). 2022. PMID: 36501386 Free PMC article.
-
Joint QTL Mapping and Transcriptome Sequencing Analysis Reveal Candidate Genes for Salinity Tolerance in Oryza sativa L. ssp. Japonica Seedlings.Int J Mol Sci. 2023 Dec 18;24(24):17591. doi: 10.3390/ijms242417591. Int J Mol Sci. 2023. PMID: 38139418 Free PMC article.
-
Genome-wide association study of seedling stage salinity tolerance in temperate japonica rice germplasm.BMC Genet. 2018 Jan 3;19(1):2. doi: 10.1186/s12863-017-0590-7. BMC Genet. 2018. PMID: 29298667 Free PMC article.
-
Genome-Wide Association Study (GWAS) to Identify Salt-Tolerance QTLs Carrying Novel Candidate Genes in Rice During Early Vegetative Stage.Rice (N Y). 2021 Jan 9;14(1):9. doi: 10.1186/s12284-020-00433-0. Rice (N Y). 2021. PMID: 33420909 Free PMC article.
Cited by
-
Effect of Soil Acidification on the Production of Se-Rich Tea.Plants (Basel). 2023 Aug 7;12(15):2882. doi: 10.3390/plants12152882. Plants (Basel). 2023. PMID: 37571035 Free PMC article.
-
Multi-locus genome-wide association studies reveal genomic regions associated with sodicity tolerance in rice.Plant Mol Biol. 2025 Jul 21;115(4):88. doi: 10.1007/s11103-025-01622-5. Plant Mol Biol. 2025. PMID: 40690060
References
-
- Jin H., Plaha P., Park J.Y., Hong C.P., Lee I.S., Yang Z.H., Jiang G.B., Kwak S.S., Liu S.K., Lee J.S., et al. Comparative EST profiles of leaf and root of Leymus chinensis, a xerophilous grass adapted to high pH sodic soil. Plant Sci. 2006;170:1081–1086. doi: 10.1016/j.plantsci.2006.01.002. - DOI
Grants and funding
LinkOut - more resources
Full Text Sources
