. 2023 May 28;15(11):2510.
doi: 10.3390/nu15112510.

Iron Complexes with Antarctic Krill-Derived Peptides Show Superior Effectiveness to Their Original Protein-Iron Complexes in Mice with Iron Deficiency Anemia

Affiliations

Iron Complexes with Antarctic Krill-Derived Peptides Show Superior Effectiveness to Their Original Protein-Iron Complexes in Mice with Iron Deficiency Anemia

Shengjie Hu et al. Nutrients. .

Abstract

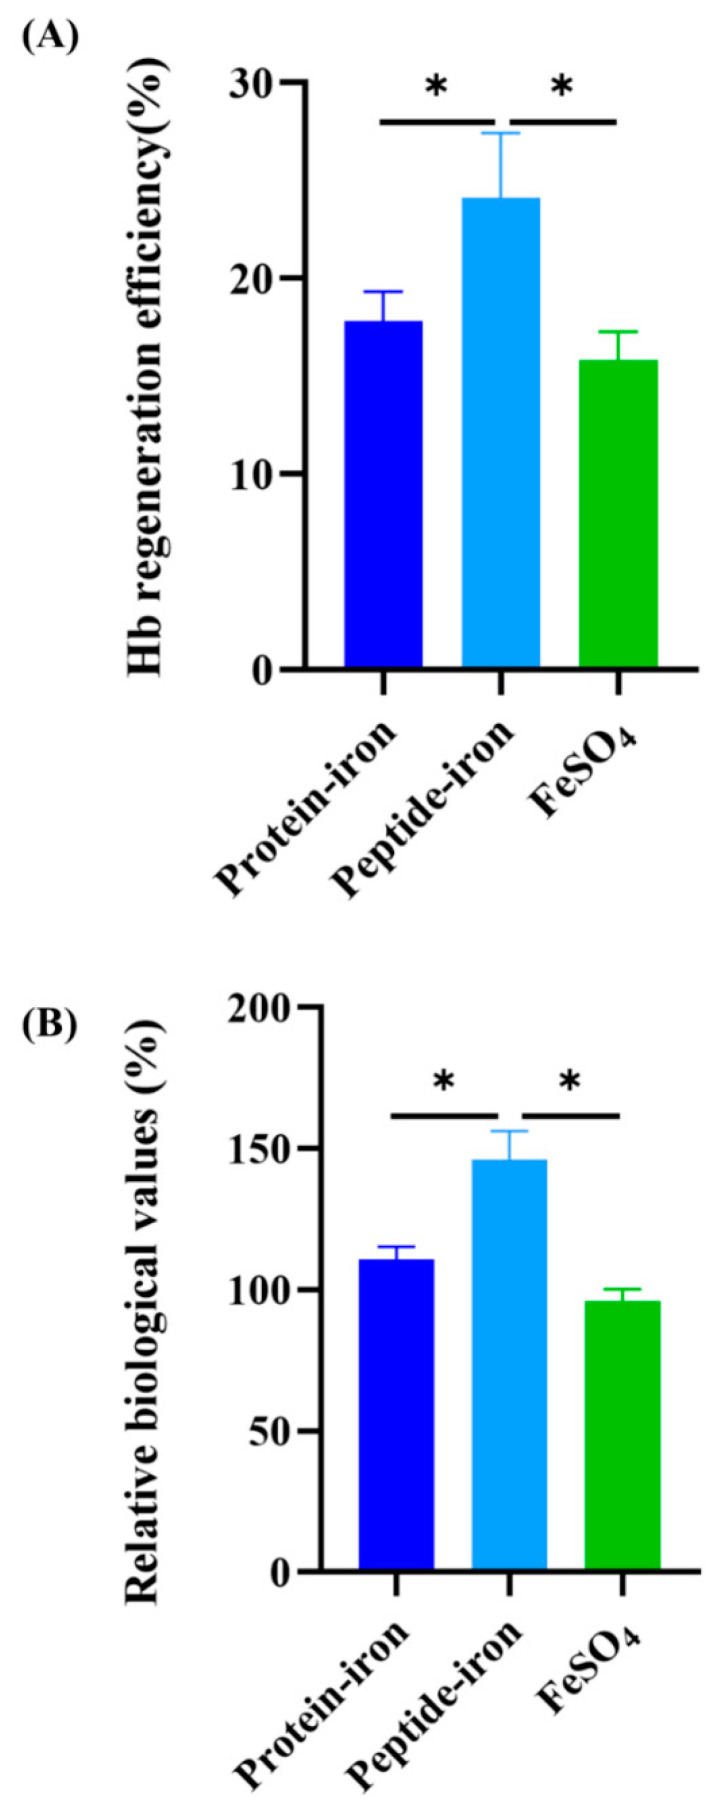
Antarctic krill protein-iron complex and peptide-iron complex were acquired to investigate their iron bioavailability, expression of iron-regulated genes, and in vivo antioxidant capacity. Results indicated that the Antarctic krill peptide-iron complex significantly increased the hemoglobin (Hb), serum iron (SI), and iron contents in the liver and spleen in iron-deficiency anemia (IDA) mice (p < 0.05) compared with those of the Antarctic krill protein-iron complex. Despite the gene expressions of the divalent metal transporter 1(DMT1), the transferrin (Tf), and the transferrin receptor (TfR) being better regulated by both Antarctic krill peptide-iron complex and protein-iron complex, the relative iron bioavailability of the Antarctic krill peptide-iron complex group (152.53 ± 21.05%) was significantly higher than that of the protein-iron complex group (112.75 ± 9.60%) (p < 0.05). Moreover, Antarctic krill peptide-iron complex could enhance the antioxidant enzyme activities of superoxidase dismutase (SOD) and glutathione peroxidase (GSH-Px), reduce the malondialdehyde (MDA) level in IDA mice compared with the protein-iron complex, and reduce the cell damage caused by IDA. Therefore, these results indicated that Antarctic krill peptide-iron complex could be used as a highly efficient and multifunctional iron supplement.

Keywords: Antarctic krill peptide–iron; IDA mice; in vivo antioxidant capacity; iron bioavailability; iron-regulated genes.


Conflict of interest statement

The authors declare no conflict of interest.

Figures

Figure 1
Figure 1
Mice experimental protocol and body weight changes in mice. (A) Mice experimental protocol: an iron−deficient diet was used for 8 weeks to establish an IDA mice model and mice were treated for 3 weeks with Antarctic krill peptide−iron complex, protein–iron complex or FeSO4; body weight and collected serum were regularly measured; at the end of the experiment, serum, stomach, duodenum, liver and spleen were collected; (B) the body weight changes after iron supplementation for different groups (control, model, Antarctic krill protein−iron complex, peptide–iron complex, and FeSO4 groups). SEM error bars are present. Significant differences are indicated by asterisks (p < 0.05).
Figure 2
Figure 2
Hb, SI, and TIBC levels of the mice in different groups. (A) The changes in Hb concentration before and after iron supplementation for different groups (control, model, Antarctic krill protein–iron complex, peptide–iron complex, and FeSO4 groups); (B) the changes in SI concentration after iron supplementation for different groups (control, model, Antarctic krill protein–iron complex, peptide–iron complex, and FeSO4 groups); (C) the changes in TIBC levels after iron supplementation for different groups (control, model, Antarctic krill protein–iron complex, peptide–iron complex, and FeSO4 groups). Data are presented as mean ± SD. Significant differences are indicated by asterisks (p < 0.05).
Figure 2
Figure 2
Hb, SI, and TIBC levels of the mice in different groups. (A) The changes in Hb concentration before and after iron supplementation for different groups (control, model, Antarctic krill protein–iron complex, peptide–iron complex, and FeSO4 groups); (B) the changes in SI concentration after iron supplementation for different groups (control, model, Antarctic krill protein–iron complex, peptide–iron complex, and FeSO4 groups); (C) the changes in TIBC levels after iron supplementation for different groups (control, model, Antarctic krill protein–iron complex, peptide–iron complex, and FeSO4 groups). Data are presented as mean ± SD. Significant differences are indicated by asterisks (p < 0.05).
Figure 3
Figure 3
The changes of iron contents of mice in the liver and spleen after iron supplementation for different groups. (A) the changes of iron contents of mice in the liver after iron supplementation for different groups (control, model, Antarctic krill protein–iron complex, peptide–iron complex, and FeSO4 groups); (B) the changes of iron contents of mice in the spleen after iron supplementation for different groups (control, model, Antarctic krill protein–iron complex, peptide–iron complex, and FeSO4 groups). Data are presented as mean ± SD. Significant differences are indicated by asterisks (p < 0.05).
Figure 4
Figure 4
Hemoglobin regeneration efficiency and relative biological value of iron-supplement groups. (A) effects of different iron supplements (Antarctic krill protein–iron complex, peptide–iron complex, and FeSO4) on hemoglobin concentration after iron supplementation; (B) analysis of the relative biological value of the iron-supplemented group (Antarctic krill protein–iron complex, peptide–iron complex, and FeSO4 groups) using the Hb regeneration efficiency of FeSO4 as a reference (100%). Data are presented as mean ± SD. Significant differences are indicated by asterisks (p < 0.05).
Figure 5
Figure 5
Effects of in the iron-supplemented group on expression of iron-regulated genes in the liver. (A) The changes of gene expression level of DMT1 of mice in the liver after iron supplementation for different groups (control, model, Antarctic krill protein–iron complex, peptide–iron complex, and FeSO4 groups); (B) the changes of gene expression level of Tf of mice in the liver after iron supplementation for different groups (control, model, Antarctic krill protein–iron complex, peptide–iron complex, and FeSO4 groups); (C) the changes of gene expression level of TfR of mice in the liver after iron supplementation for different groups (control, model, Antarctic krill protein–iron complex, peptide–iron complex, and FeSO4 groups). Data are presented as mean ± SD. Significant differences are indicated by asterisks (p < 0.05).
Figure 5
Figure 5
Effects of in the iron-supplemented group on expression of iron-regulated genes in the liver. (A) The changes of gene expression level of DMT1 of mice in the liver after iron supplementation for different groups (control, model, Antarctic krill protein–iron complex, peptide–iron complex, and FeSO4 groups); (B) the changes of gene expression level of Tf of mice in the liver after iron supplementation for different groups (control, model, Antarctic krill protein–iron complex, peptide–iron complex, and FeSO4 groups); (C) the changes of gene expression level of TfR of mice in the liver after iron supplementation for different groups (control, model, Antarctic krill protein–iron complex, peptide–iron complex, and FeSO4 groups). Data are presented as mean ± SD. Significant differences are indicated by asterisks (p < 0.05).
Figure 6
Figure 6
Effects of iron-supplemented group on in vivo antioxidant enzymes activity and level of mice. (A) The changes of SOD activity of mice in the gastric tissue after iron supplementation for different groups (control, model, Antarctic krill protein–iron complex, peptide–iron complex, and FeSO4 groups); (B) the changes of GSH-Px activity of mice in the gastric tissue after iron supplementation for different groups (control, model, Antarctic krill protein–iron complex, peptide–iron complex, and FeSO4 groups); (C) the changes of MDA concentration of mice in the gastric tissue after iron supplementation for different groups (control, model, Antarctic krill protein–iron complex, peptide–iron complex, and FeSO4 groups). Data are presented as mean ± SD. Significant differences are indicated by asterisks (p < 0.05).
Figure 6
Figure 6
Effects of iron-supplemented group on in vivo antioxidant enzymes activity and level of mice. (A) The changes of SOD activity of mice in the gastric tissue after iron supplementation for different groups (control, model, Antarctic krill protein–iron complex, peptide–iron complex, and FeSO4 groups); (B) the changes of GSH-Px activity of mice in the gastric tissue after iron supplementation for different groups (control, model, Antarctic krill protein–iron complex, peptide–iron complex, and FeSO4 groups); (C) the changes of MDA concentration of mice in the gastric tissue after iron supplementation for different groups (control, model, Antarctic krill protein–iron complex, peptide–iron complex, and FeSO4 groups). Data are presented as mean ± SD. Significant differences are indicated by asterisks (p < 0.05).
Figure 7
Figure 7
Histopathological examination of liver and spleen of mice after iron supplementation for different groups. (A) Representative images of liver and spleen in control group stained with H&E and photographed 40× magnifications; (B) representative images of liver and spleen in model group stained with H&E and photographed 40× magnifications; (C) representative images of liver and spleen in Antarctic krill protein–iron group stained with H&E and photographed 40× magnifications; (D) representative images of liver and spleen in Antarctic krill peptide–iron group stained with H&E and photographed 40× magnifications; (E) representative images of liver and spleen in FeSO4 group stained with H&E and photographed 40× magnifications. Black arrows showing monocyte infiltration in the portal area and fine hemosiderin pigment deposited in individual macrophages in the liver, and the obvious appearance of tangible body macrophages and inflammatory cells in the spleen.

Similar articles

References

    1. Sangkhae V., Nemeth E. Regulation of the Iron Homeostatic Hormone Hepcidin. Adv. Nutr. 2017;8:126–136. doi: 10.3945/an.116.013961. - DOI - PMC - PubMed
    1. Camaschella C. Iron-deficiency anemia. N. Engl. J. Med. 2015;372:1832–1843. doi: 10.1056/NEJMra1401038. - DOI - PubMed
    1. Ross E.M. Evaluation and treatment of iron deficiency in adults. Nutr. Clin. Care. 2002;5:220–224. doi: 10.1046/j.1523-5408.2002.05503.x. - DOI - PubMed
    1. Corrons J.L.V., Miguel-Garcia A., Pujades M.A., Miguel-Sosa A., Cambiazzo S., Linares M., Dibarrart M.T., Calvo M.A. Increased susceptibility of microcytic red blood cells to in vitro oxidative stress. Eur. J. Haematol. 1995;55:327–331. doi: 10.1111/j.1600-0609.1995.tb00705.x. - DOI - PubMed
    1. Sharp P., Srai S.K. Molecular mechanisms involved in intestinal iron absorption. World J. Gastroenterol. WJG. 2007;13:4716. doi: 10.3748/wjg.v13.i35.4716. - DOI - PMC - PubMed

LinkOut - more resources