Meta-Analysis
. 2023 Jun 1;15(11):2604.
doi: 10.3390/nu15112604.

The Effect of Intermittent Fasting on Appetite: A Systematic Review and Meta-Analysis

Affiliations
Meta-Analysis

The Effect of Intermittent Fasting on Appetite: A Systematic Review and Meta-Analysis

Rebecca L Elsworth et al. Nutrients. .

Abstract

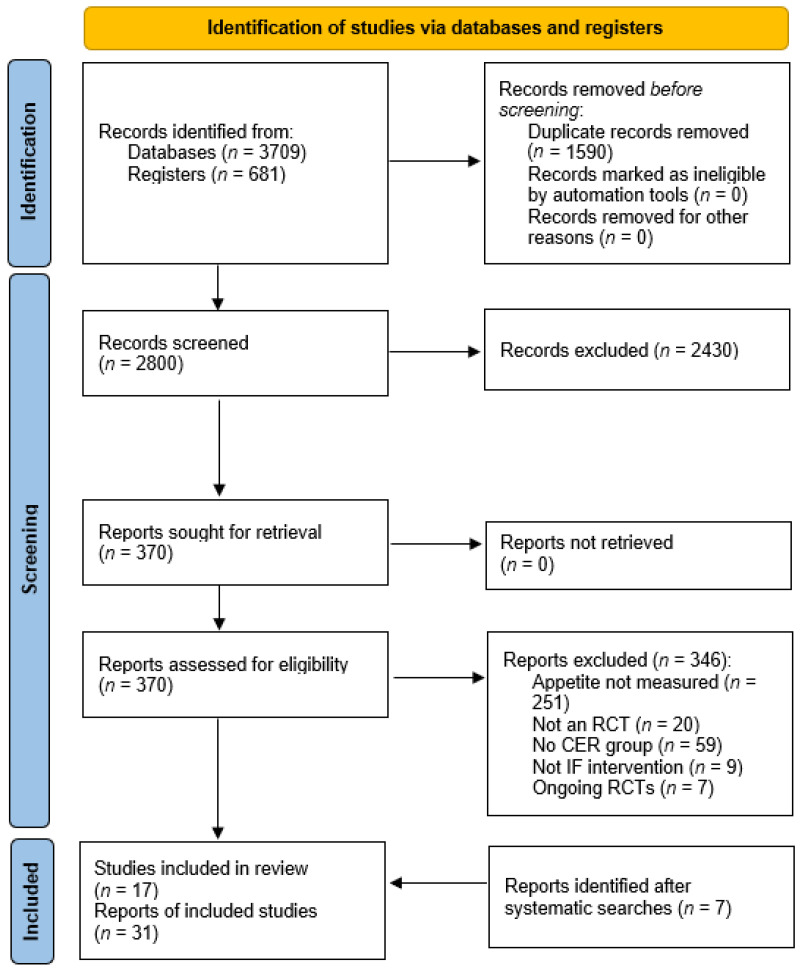
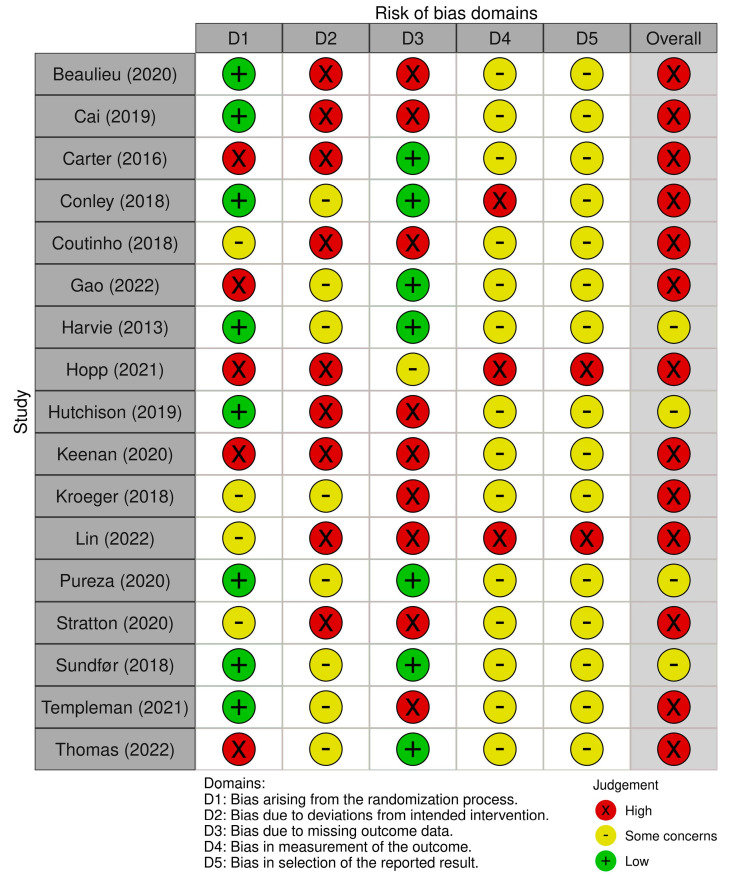
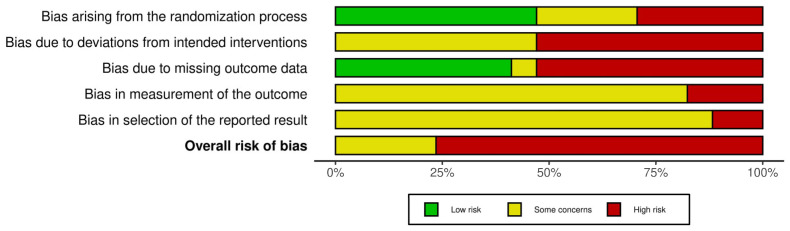
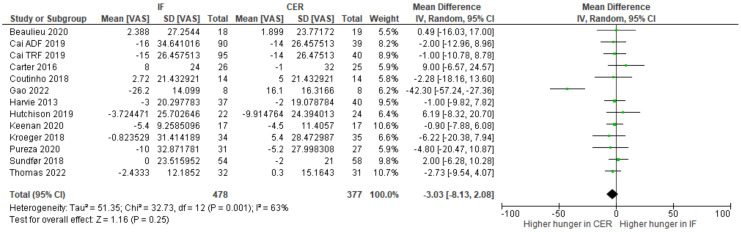
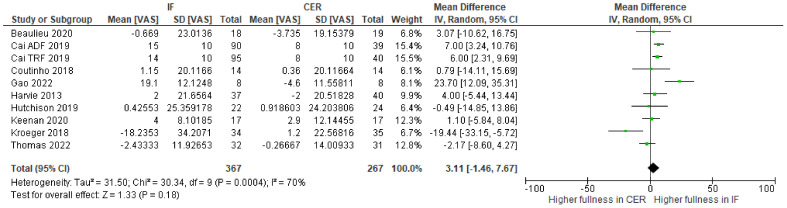
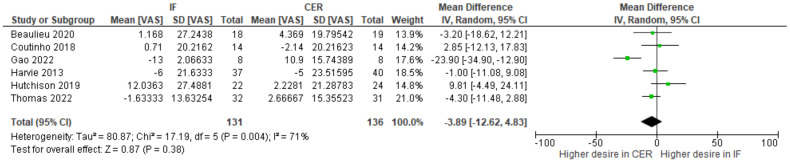
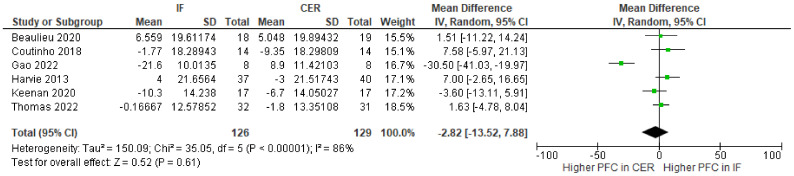
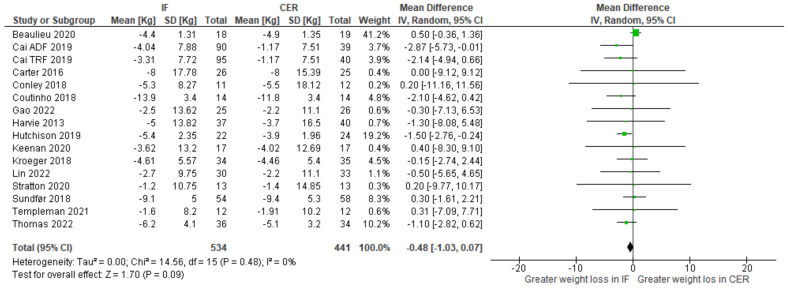
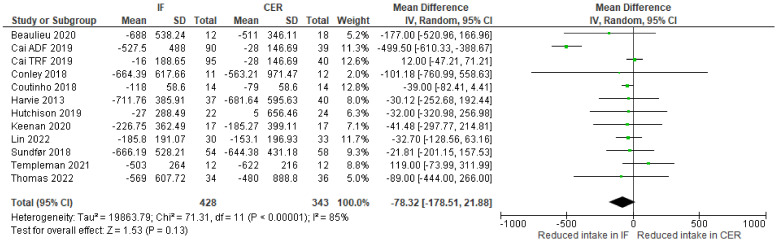
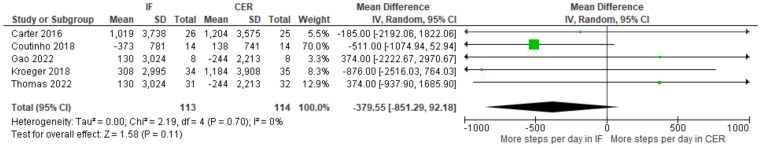
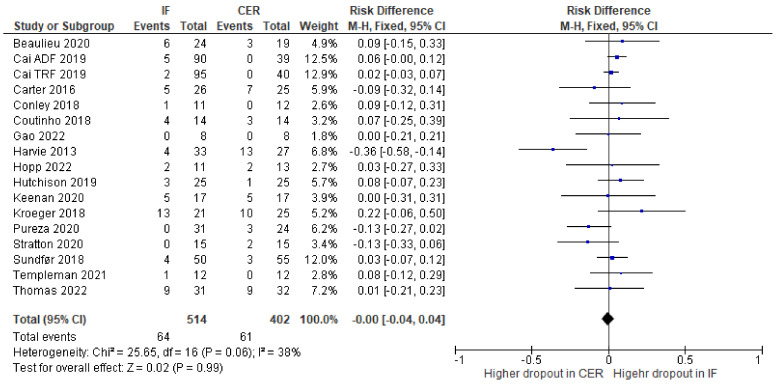
Previously, narrative reviews have considered the effects of intermittent fasting on appetite. One suggestion is that intermittent fasting attenuates an increase in appetite that typically accompanies weight loss. Here, we conducted the first systematic review and meta-analysis to quantify the effects of intermittent fasting on appetite, when compared to a continuous energy restriction intervention. Five electronic databases and trial registers were searched in February 2021 and February 2022. Abstracts (N = 2800) were screened and 17 randomized controlled trials (RCTs), consisting of a variety of intermittent fasting regimes, met our inclusion criteria. The total number of participants allocated to interventions was 1111 and all RCTs were judged as having either some concerns or a high risk of bias (Cochrane RoB 2.0 tool). Random effects meta-analyses were conducted on change-from-baseline appetite ratings. There was no clear evidence that intermittent fasting affected hunger (WMD = -3.03; 95% CI [-8.13, 2.08]; p = 0.25; N = 13), fullness (WMD = 3.11; 95% CI [-1.46, 7.69]; p = 0.18; N = 10), desire to eat (WMD = -3.89; 95% CI [-12.62, 4.83]; p = 0.38; N = 6), or prospective food consumption (WMD = -2.82; 95% CI [-3.87, 9.03]; p = 0.43; N = 5), differently to continuous energy restriction interventions. Our results suggest that intermittent fasting does not mitigate an increase in our drive to eat that is often associated with continuous energy restriction.

Keywords: 5:2 dieting; alternate day fasting; appetite; fullness; hunger; intermittent fasting; time-restricted eating.


Conflict of interest statement

The authors declare no conflict of interest. The funders had no role in the design of the study; in the collection, analyses, or interpretation of data; in the writing of the manuscript; or in the decision to publish the results.

Figures

Figure 1
Figure 1
PRISMA 2020 flow diagram [22,32]. CER: continuous energy restriction. IF: intermittent fasting.
Figure 2
Figure 2
Results from the Cochrane Risk of Bias 2 (RoB 2.0) tool for each study independently. Figure created using the robvis web app [33,34,35,36,37,38,39,40,41,42,43,44,45,46,47,48,49,50].
Figure 3
Figure 3
Summary of risk of bias results (n = 17). Figure created using the robvis web app [50].
Figure 4
Figure 4
Meta--analysis of change-from-baseline hunger VAS ratings. The forest plot shows effect estimates (green blocks) and 95% confidence intervals (horizontal lines) for each RCT. Larger green blocks indicate a larger weight has been assigned to that RCT. Left of the 0 line shows a finding in favour of intermittent fasting (IF) interventions, whereas right of the 0 line shows a finding in favour of continuous energy restriction (CER) interventions. The diamond at the base of the plot demonstrates the pooled effect estimates and confidence intervals from all RCTs included in the meta-analysis [33,35,36,37,38,41,42,43,44,45,47,49].
Figure 5
Figure 5
Meta-analysis of change-from-baseline fullness VAS ratings. The forest plot shows effect estimates (green blocks) and 95% confidence intervals (horizontal lines) for each RCT. Larger green blocks indicate a larger weight has been assigned to that RCT. Right of the 0 line shows a finding in favour of intermittent fasting (IF) interventions, whereas left of the 0 line shows a finding in favour of continuous energy restriction (CER) interventions. The diamond at the base of the plot demonstrates the pooled effect estimates and confidence intervals from all RCTs included in the meta-analysis [35,36,37,38,41,42,44,47,49].
Figure 6
Figure 6
Metaanalysis of change-from-baseline desire to eat VAS ratings. The forest plot shows effect estimates (green blocks) and 95% confidence intervals (horizontal lines) for each RCT. Larger green blocks indicate a larger weight has been assigned to that RCT. Left of the 0 line shows a finding in favour of intermittent fasting (IF) interventions, whereas right of the 0 line shows a finding in favour of continuous energy restriction (CER) interventions. The diamond at the base of the plot demonstrates the pooled effect estimates and confidence intervals from all RCTs included in the meta-analysis [35,36,37,41,44,47].
Figure 7
Figure 7
Meta-analysis of change-from-baseline prospective food consumption (PFC) VAS ratings. The forest plot shows effect estimates (green blocks) and 95% confidence intervals (horizontal lines) for each RCT. Larger green blocks indicate a larger weight has been assigned to that RCT. Left of the 0 line shows a finding in favour of intermittent fasting (IF) interventions, whereas right of the 0 line shows a finding in favour of continuous energy restriction (CER) interventions. The diamond at the base of the plot demonstrates the pooled effect estimates and confidence intervals from all RCTs included in the meta-analysis [35,36,41,42,44,47].
Figure 8
Figure 8
Meta-analysis of change-from-baseline weight (kg). The forest plot shows effect estimates (green blocks) and 95% confidence intervals (horizontal lines) for each RCT. Larger green blocks indicate a larger weight has been assigned to that RCT. Left of the 0 line shows a finding in favour of intermittent fasting (IF) interventions, whereas right of the 0 line shows a finding in favour of continuous energy restriction (CER) interventions. The diamond at the base of the plot demonstrates the pooled effect estimates and confidence intervals from all RCTs included in the meta-analysis [33,34,35,36,37,38,39,41,42,43,44,46,47,48,49].
Figure 9
Figure 9
Metaanalysis of change-from-baseline weekly energy intake (kcal). The forest plot shows effect estimates (green blocks) and 95% confidence intervals (horizontal lines) for each RCT. Larger green blocks indicate a larger weight has been assigned to that RCT. Left of the 0 line shows a finding in favour of intermittent fasting (IF) interventions, whereas right of the 0 line shows a finding in favour of continuous energy restriction (CER) interventions. The diamond at the base of the plot demonstrates the pooled effect estimates and confidence intervals from all RCTs included in the meta-analysis [34,35,36,37,39,41,42,43,47,48,49].
Figure 10
Figure 10
Meta-analysis of change from steps per day. The forest plot shows effect estimates (green blocks) and 95% confidence intervals (horizontal lines) for each RCT. Larger green blocks indicate a larger weight has been assigned to that RCT. Left of the 0 line shows a finding in favour of intermittent fasting (IF) interventions, whereas right of the 0 line shows a finding in favour of continuous energy restriction (CER) interventions. The diamond at the base of the plot demonstrates the pooled effect estimates and confidence intervals from all RCTs included in the meta-analysis [33,36,38,44,47].
Figure 11
Figure 11
Forest plot for meta-analysis of participant dropout from RCTs. Risk difference reflects difference in dropout between intermittent fasting (IF) interventions and continuous energy restriction (CER) interventions. Larger green blocks indicate a larger weight has been assigned to that RCT. Left of the 0 line shows a finding in favour of intermittent fasting (IF) interventions, whereas right of the 0 line shows a finding in favour of continuous energy restriction (CER) interventions. The diamond at the base of the plot represents the summary result [33,34,35,36,37,38,39,40,41,42,43,44,45,46,47,49].

References

    1. Varady K.A. Intermittent versus daily calorie restriction: Which diet regimen is more effective for weight loss?: Weight Loss by Calorie Restriction Diets. Obes. Rev. 2011;12:e593–e601. doi: 10.1111/j.1467-789X.2011.00873.x. - DOI - PubMed
    1. Davis C.S., Clarke R.E., Coulter S.N., Rounsefell K.N., Walker R.E., Rauch C.E., Huggins C.E., Ryan L. Intermittent energy restriction and weight loss: A systematic review. Eur. J. Clin. Nutr. 2015;70:292–299. doi: 10.1038/ejcn.2015.195. - DOI - PubMed
    1. Welton S., Fcfp T.O., Willms H., Rpn D.P., Fcfp S.M. Intermittent fasting and weight loss: Systematic review. Can. Fam. Physician. 2020;66:117–125. - PMC - PubMed
    1. Harris L., Hamilton S., Azevedo L.B., Olajide J., De Brún C., Waller G., Whittaker V., Sharp T., Lean M., Hankey C., et al. Intermittent fasting interventions for treatment of overweight and obesity in adults: A Systematic Review and Meta-Analysis. JBI Database Syst. Rev. Implement. Rep. 2018;16:507–547. doi: 10.11124/JBISRIR-2016-003248. - DOI - PubMed
    1. De Cabo R., Mattson M.P. Effects of intermittent fasting on health, aging, and disease. N. Engl. J. Med. 2019;381:2541–2551. doi: 10.1056/NEJMra1905136. - DOI - PubMed

LinkOut - more resources