

Characterisation of Fasting and Postprandial NMR Metabolites: Insights from the ZOE PREDICT 1 Study
- PMID: 37299601
- PMCID: PMC10255657
- DOI: 10.3390/nu15112638
Characterisation of Fasting and Postprandial NMR Metabolites: Insights from the ZOE PREDICT 1 Study
Abstract
Background: Postprandial metabolomic profiles and their inter-individual variability are not well characterised. Here, we describe postprandial metabolite changes, their correlations with fasting values and their inter- and intra-individual variability, following a standardised meal in the ZOE PREDICT 1 cohort.
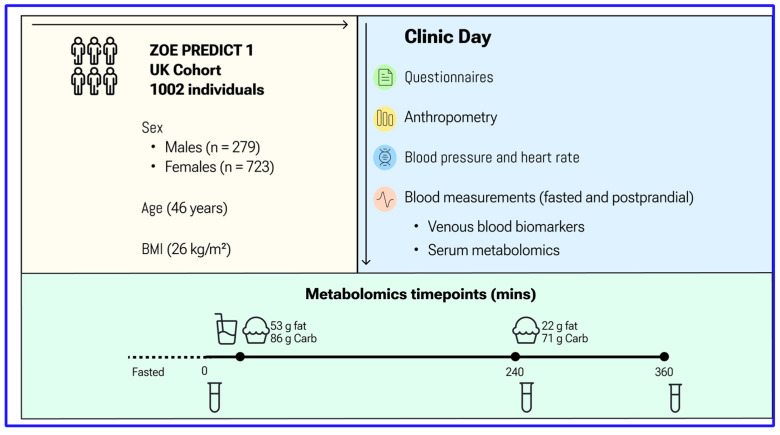
Methods: In the ZOE PREDICT 1 study (n = 1002 (NCT03479866)), 250 metabolites, mainly lipids, were measured by a Nightingale NMR panel in fasting and postprandial (4 and 6 h after a 3.7 MJ mixed nutrient meal, with a second 2.2 MJ mixed nutrient meal at 4 h) serum samples. For each metabolite, inter- and intra-individual variability over time was evaluated using linear mixed modelling and intraclass correlation coefficients (ICC) were calculated.
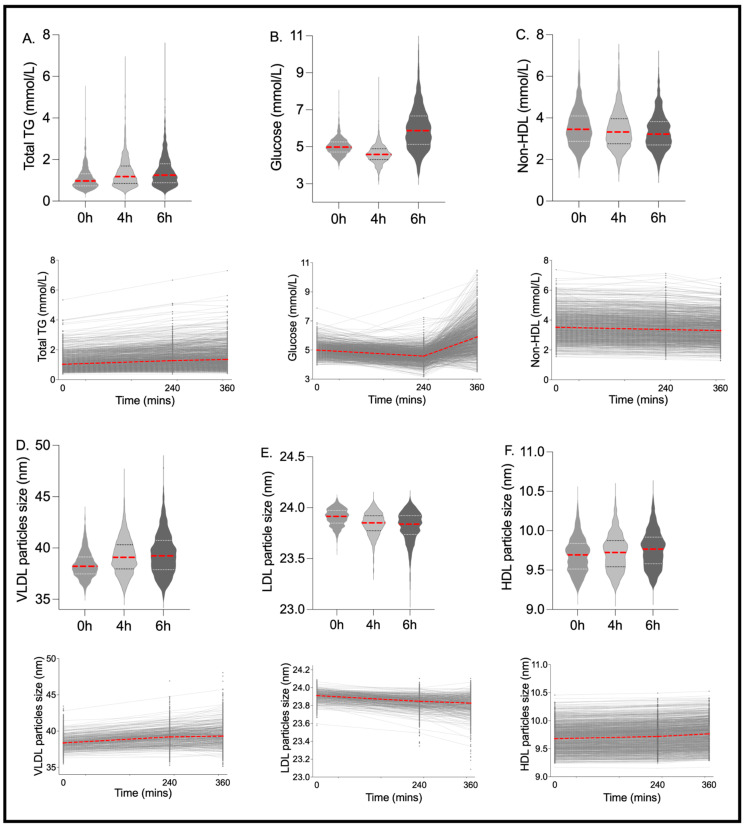
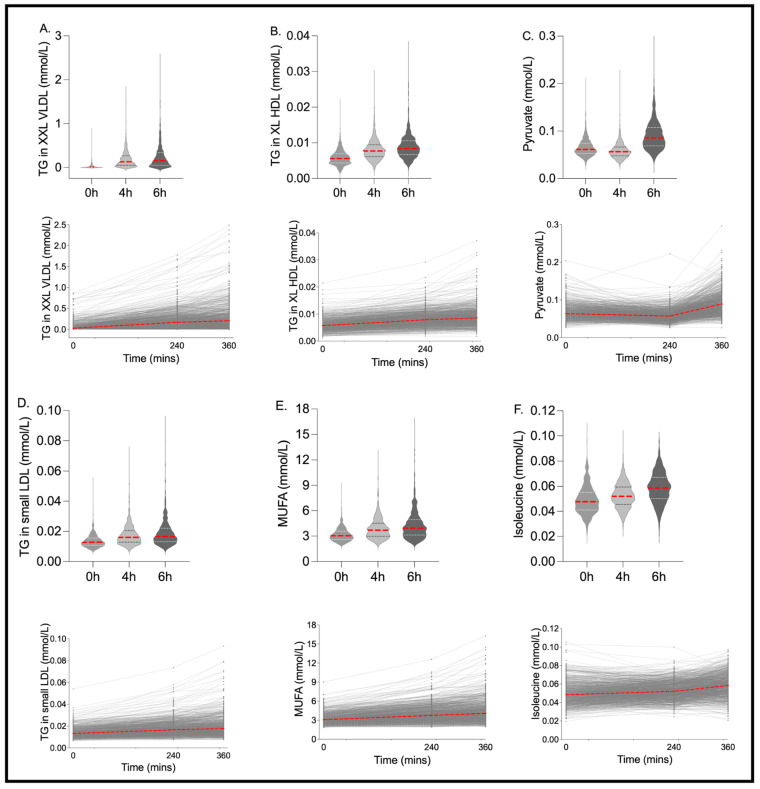
Results: Postprandially, 85% (of 250 metabolites) significantly changed from fasting at 6 h (47% increased, 53% decreased; Kruskal-Wallis), with 37 measures increasing by >25% and 14 increasing by >50%. The largest changes were observed in very large lipoprotein particles and ketone bodies. Seventy-one percent of circulating metabolites were strongly correlated (Spearman's rho >0.80) between fasting and postprandial timepoints, and 5% were weakly correlated (rho <0.50). The median ICC of the 250 metabolites was 0.91 (range 0.08-0.99). The lowest ICCs (ICC <0.40, 4% of measures) were found for glucose, pyruvate, ketone bodies (β-hydroxybutyrate, acetoacetate, acetate) and lactate.
Conclusions: In this large-scale postprandial metabolomic study, circulating metabolites were highly variable between individuals following sequential mixed meals. Findings suggest that a meal challenge may yield postprandial responses divergent from fasting measures, specifically for glycolysis, essential amino acid, ketone body and lipoprotein size metabolites.
Keywords: lipids; lipoproteins; nuclear magnetic resonance (NMR).
Conflict of interest statement
A.M.V., P.W.F., T.D.S. and S.E.B. are consultants to ZOE Ltd. J.W., G.H. and T.D.S. are cofounders of ZOE Ltd. A.M.V., P.W.F., T.D.S., S.E.B., J.W. and G.H. receive options from ZOE Ltd. I.L. is employed by ZOE Ltd. Other authors have no conflict of interest to declare.
Figures
References
-
- Deelen J., Kettunen J., Fischer K., van der Spek A., Trompet S., Kastenmüller G., Boyd A., Zierer J., van den Akker E.B., Ala-Korpela M., et al. A metabolic profile of all-cause mortality risk identified in an observational study of 44,168 individuals. Nat. Commun. 2019;10:3346. doi: 10.1038/s41467-019-11311-9. - DOI - PMC - PubMed
-
- Menni C., Fauman E., Erte I., Perry J.R., Kastenmüller G., Shin S.Y., Petersen A.-K., Hyde C., Psatha M., Ward K.J., et al. Biomarkers for type 2 diabetes and impaired fasting glucose using a nontargeted metabolomics approach. Diabetes. 2013;62:4270–4276. doi: 10.2337/db13-0570. - DOI - PMC - PubMed
-
- Menni C., Graham D., Kastenmüller G., Alharbi N.H., Alsanosi S.M., McBride M., Mangino M., Titcombe P., Shin S.-Y., Psatha M., et al. Metabolomic identification of a novel pathway of blood pressure regulation involving hexadecanedioate. Hypertension. 2015;66:422–429. doi: 10.1161/HYPERTENSIONAHA.115.05544. - DOI - PMC - PubMed
-
- Moayyeri A., Cheung C.L., Tan K.C., Morris J.A., Cerani A., Mohney R.P., Richards J.B., Hammond C., Spector T.D., Menni C. Metabolomic Pathways to Osteoporosis in Middle-Aged Women: A Genome-Metabolome-Wide Mendelian Randomization Study. J. Bone Miner. Res. 2018;33:643–650. doi: 10.1002/jbmr.3358. - DOI - PMC - PubMed
