Review
. 2023 May 23;23(11):5010.
doi: 10.3390/s23115010.

Data Science Methods and Tools for Industry 4.0: A Systematic Literature Review and Taxonomy

Affiliations
Review

Data Science Methods and Tools for Industry 4.0: A Systematic Literature Review and Taxonomy

Helder Moreira Arruda et al. Sensors (Basel). .

Abstract

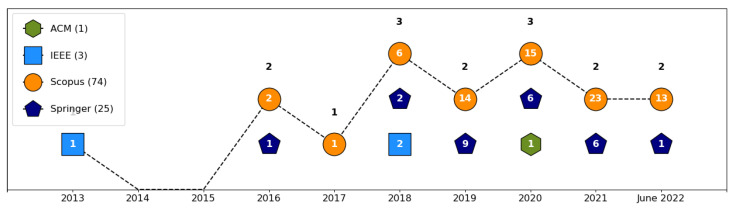
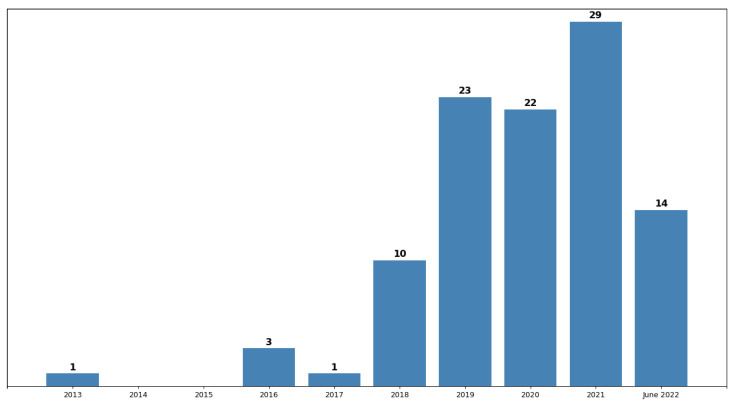
The Fourth Industrial Revolution, also named Industry 4.0, is leveraging several modern computing fields. Industry 4.0 comprises automated tasks in manufacturing facilities, which generate massive quantities of data through sensors. These data contribute to the interpretation of industrial operations in favor of managerial and technical decision-making. Data science supports this interpretation due to extensive technological artifacts, particularly data processing methods and software tools. In this regard, the present article proposes a systematic literature review of these methods and tools employed in distinct industrial segments, considering an investigation of different time series levels and data quality. The systematic methodology initially approached the filtering of 10,456 articles from five academic databases, 103 being selected for the corpus. Thereby, the study answered three general, two focused, and two statistical research questions to shape the findings. As a result, this research found 16 industrial segments, 168 data science methods, and 95 software tools explored by studies from the literature. Furthermore, the research highlighted the employment of diverse neural network subvariations and missing details in the data composition. Finally, this article organized these results in a taxonomic approach to synthesize a state-of-the-art representation and visualization, favoring future research studies in the field.

Keywords: Industry 4.0; data science; literature review; machine learning; taxonomy.


Conflict of interest statement

The authors declare no conflict of interest.

Figures

Figure 1
Figure 1
Sequence of the four stages of the research: planning, execution, analysis and reporting. Each stage is organized into three substeps.
Figure 2
Figure 2
The number of papers retrieved from each database: (a) from the initial search; (b) after exclusion criteria 1 and 2; (c) after exclusion criterion 3; (d) after exclusion criterion 4; (e) after exclusion criterion 5; (f) after exclusion criterion 6. Exclusion criterion 4 discarded the remaining papers from Wiley. Scopus had the greatest number of works selected for the corpus, followed by Springer, IEEE, and ACM.
Figure 3
Figure 3
The diagram shows nine tables created to support the systematic review and a view with the essential data of the Zotero database. The table “Paper” is the central entity and has a one-to-one relationship with the view “Sysmap”. The other main tables are “Industry”, “Question”, “Tool”, and “Method”, besides the auxiliary tables “PaperIndustry”, “PaperQuestion”, “PaperTool”, and “PaperMethod”.
Figure 4
Figure 4
The figure shows the five databases used in the study (ACM, IEEE, Scopus, Springer, and Wiley) with the number of papers discarded after each one of the exclusion criteria applied. The number of papers after the initial search, the combination, and the final step is shown in blue. The number of papers discarded by the exclusion criteria is displayed in red.
Figure 5
Figure 5
Data science methods grouped by year. The definition of each method is in Table A2. Long short-term memory—LSTM was the method with the most occurrences (22), followed by support vector machine—SVM (19), and random forest—RF (14). For better visualization, only methods with more than two occurrences appear in the picture.
Figure 6
Figure 6
Software tools grouped by year. The definition of each tool is in Table A3. Python was the tool with the most occurrences (20), followed by Keras (15), and Tensorflow (13). For a better visualization, only tools with more than one occurrence appear in the picture.
Figure 7
Figure 7
The number of papers in each database by year. Of the five databases used in this work, only four had papers in the corpus. Scopus was the database with the greatest number of studies (74), followed by Springer (25), IEEE (3), and ACM (1). Wiley stayed out of the corpus with no papers selected.
Figure 8
Figure 8
The number of publications present in corpus per year. The years with the higher number of works published were 2019, 2020, and 2021 with 23, 22, and 29 papers, respectively. The years refer to the papers’ publication date.
Figure 9
Figure 9
Types of publication by year, classified as conference, journal, or workshop. The number inside the geometric shapes is the identification code of the paper in the corpus. The years 2019, 2020, and 2021 with 23, 22, and 29 papers, respectively, had the biggest number of publications. Overall, there were 65 publications from journals, 32 from conferences, and 6 presented in workshops.
Figure 10
Figure 10
The taxonomy has three main branches: industry, methods, and tools. Industry organizes the papers into industrial segments, according to the International Labour Organization. Methods depict the data science methods employed in the papers. Tools organize the software tools used in the works.
Figure 11
Figure 11
The methods branch presents the data science methods split into data structure, machine learning, mathematical, metric, statistical, symbolic, visual analytics, process, and combinatorial search. As a result of the significant number of specialized methods, the machine learning branch is presented in more detail in Figure 12.
Figure 12
Figure 12
Machine learning branch has the following organization: clustering, decision trees, ensemble, Gaussian processes, linear models, naive Bayes, nearest neighbors, neural networks, reinforcement learning, support vector machines, transfer learning, genetic algorithm, and AutoML.
Figure 13
Figure 13
The tools branch presents the software tools used by the authors, split into anomaly detection, databases, distributed computing, model, prediction, programming languages, toolkits, visualization, and reasoner. All the branches represent one or more ramifications.

References

    1. Kagermann H., Wahlster W., Helbig J. Recommendations for Implementing the Strategic Initiative INDUSTRIE 4.0. Acatech—National Academy of Science and Engineering, Forschungsunion; Berlin, Germany: 2013. Technical Report.
    1. Lu Y. Industry 4.0: A survey on technologies, applications and open research issues. J. Ind. Inf. Integr. 2017;6:1–10. doi: 10.1016/j.jii.2017.04.005. - DOI
    1. Liao Y., Deschamps F., Loures E.d.F.R., Ramos L.F.P. Past, present and future of Industry 4.0—A systematic literature review and research agenda proposal. Int. J. Prod. Res. 2017;55:3609–3629. doi: 10.1080/00207543.2017.1308576. - DOI
    1. Bavaresco R., Arruda H., Rocha E., Barbosa J., Li G.P. Internet of Things and occupational well-being in industry 4.0: A systematic mapping study and taxonomy. Comput. Ind. Eng. 2021;161:107670. doi: 10.1016/j.cie.2021.107670. - DOI
    1. Davenport T.H., Patil D.J. Data Scientist: The Sexiest Job of the 21st Century. Harv. Bus. Rev. 2012;90:70–76. - PubMed