. 2023 Aug;22(8):e13872.
doi: 10.1111/acel.13872. Epub 2023 Jun 10.

Explainable machine learning framework to predict personalized physiological aging

Affiliations

Explainable machine learning framework to predict personalized physiological aging

David Bernard et al. Aging Cell. 2023 Aug.

Abstract

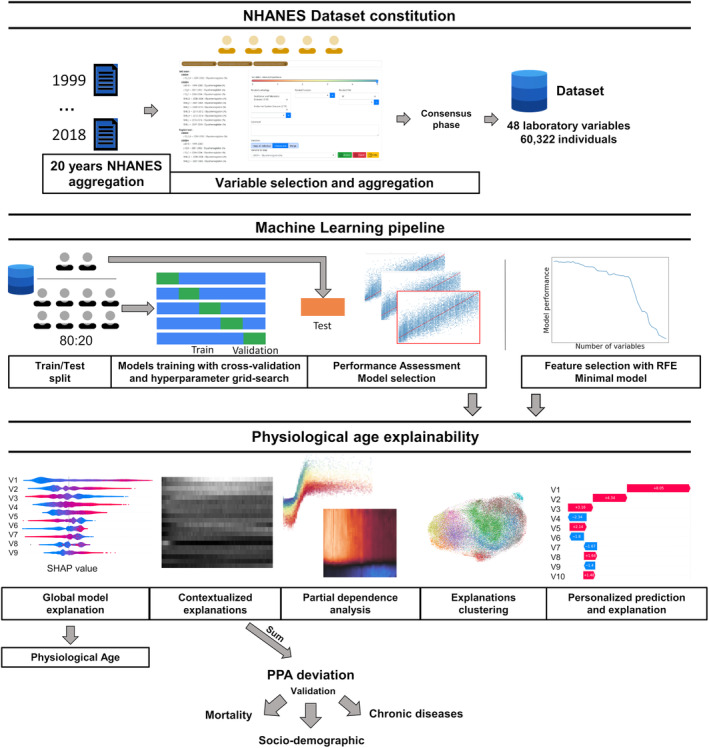
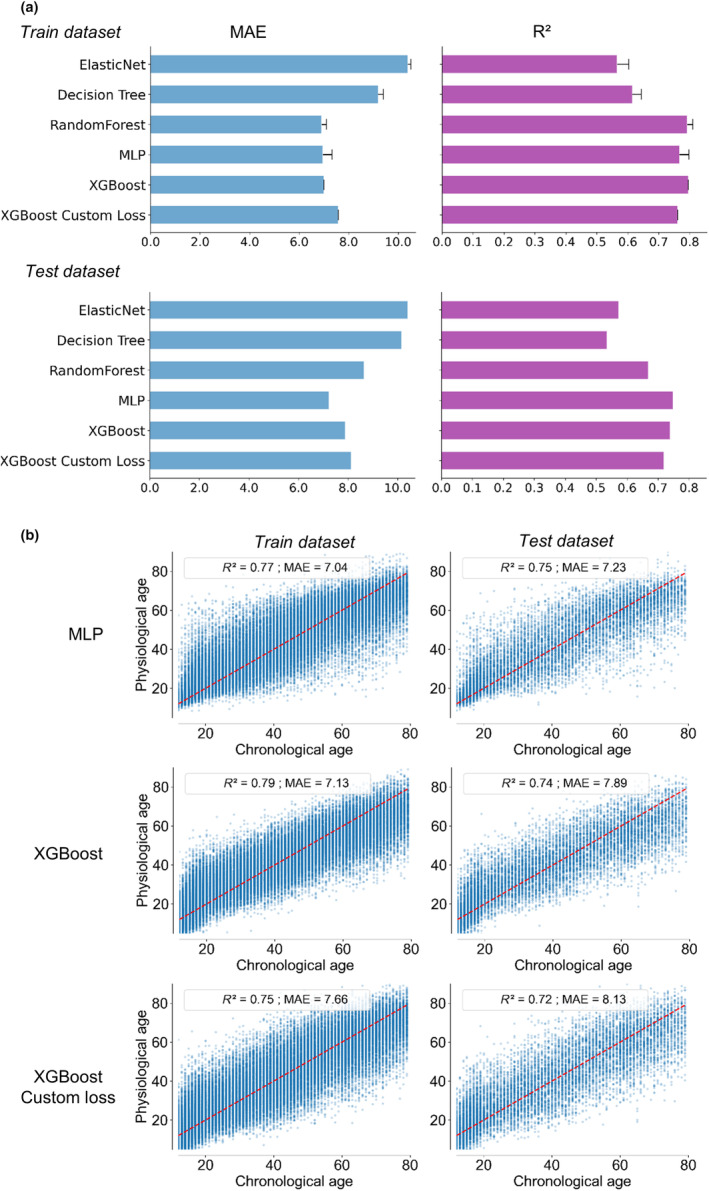
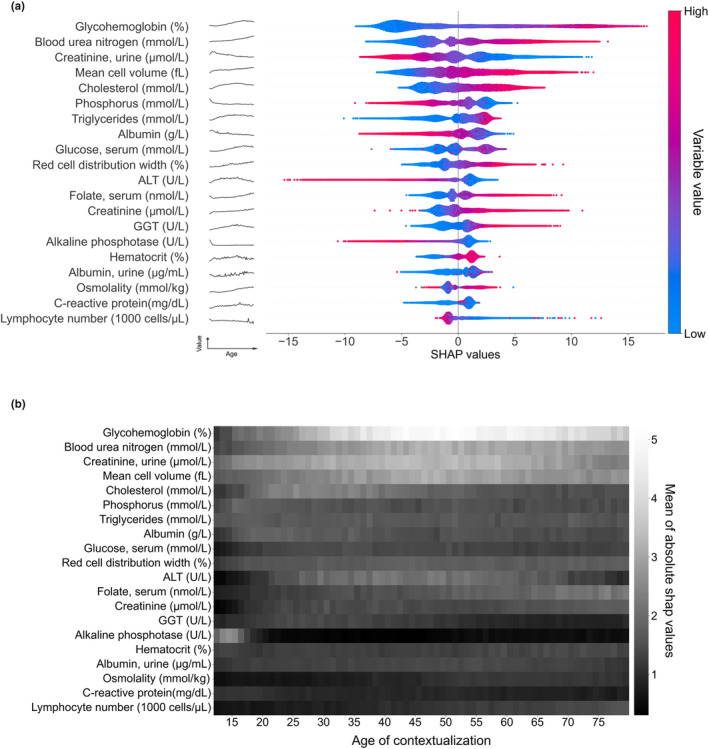
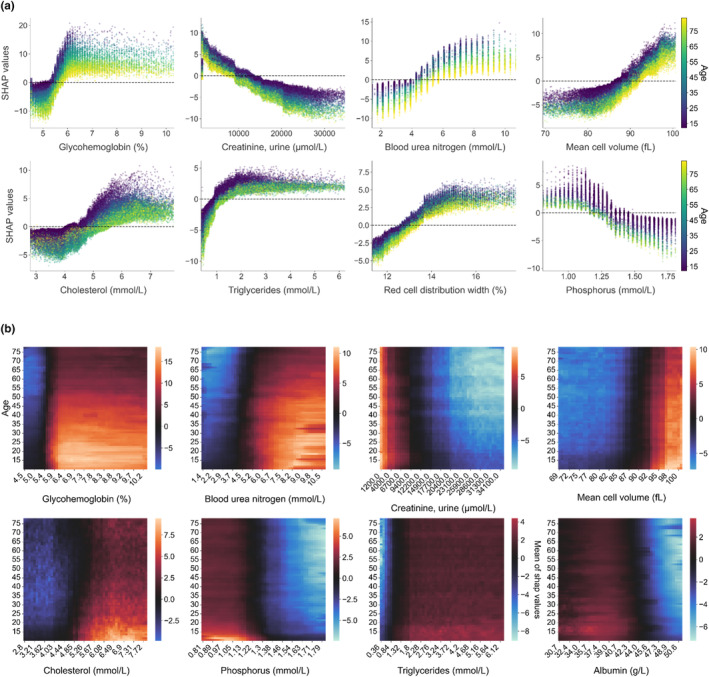
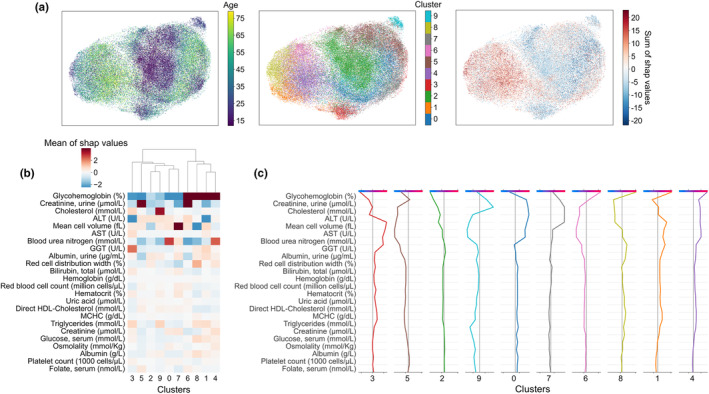
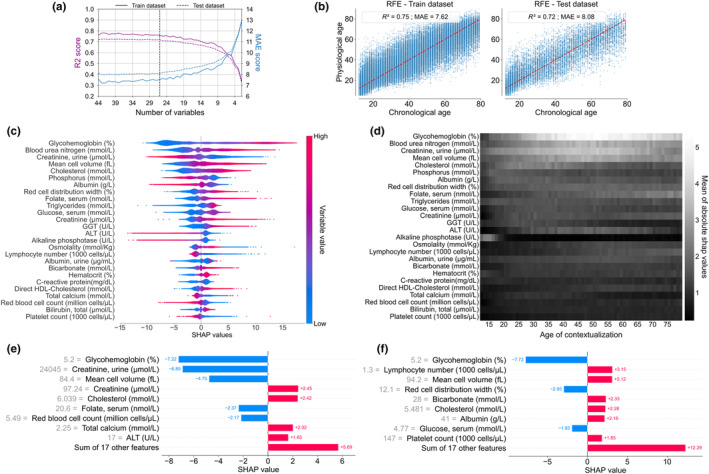
Attaining personalized healthy aging requires accurate monitoring of physiological changes and identifying subclinical markers that predict accelerated or delayed aging. Classic biostatistical methods most rely on supervised variables to estimate physiological aging and do not capture the full complexity of inter-parameter interactions. Machine learning (ML) is promising, but its black box nature eludes direct understanding, substantially limiting physician confidence and clinical usage. Using a broad population dataset from the National Health and Nutrition Examination Survey (NHANES) study including routine biological variables and after selection of XGBoost as the most appropriate algorithm, we created an innovative explainable ML framework to determine a Personalized physiological age (PPA). PPA predicted both chronic disease and mortality independently of chronological age. Twenty-six variables were sufficient to predict PPA. Using SHapley Additive exPlanations (SHAP), we implemented a precise quantitative associated metric for each variable explaining physiological (i.e., accelerated or delayed) deviations from age-specific normative data. Among the variables, glycated hemoglobin (HbA1c) displays a major relative weight in the estimation of PPA. Finally, clustering profiles of identical contextualized explanations reveal different aging trajectories opening opportunities to specific clinical follow-up. These data show that PPA is a robust, quantitative and explainable ML-based metric that monitors personalized health status. Our approach also provides a complete framework applicable to different datasets or variables, allowing precision physiological age estimation.

Keywords: Explainability; Rejuvenative therapy; artificial intelligence; biological age; healthy aging; machine learning; personalized medicine; physiological age.


Conflict of interest statement

The authors declare no competing interests.

Figures

FIGURE 1
FIGURE 1
Machine learning analysis pipeline. All data from the National Health and Nutrition Examination Surveys (i.e., NHANES study) 1999–2018 were collected. A large, consistent database containing the maximal number of common biological variables reported on the maximal number of subjects, and with minimal missing data was generated. This resulted in a dataset with 60,402 individuals with 48 biological variables and 0.01% missing data. Using this dataset, five classes of algorithm models were trained, tested and compared based on performance. The XGBoost model with custom loss was considered (see Figure 2), and explainability was computed using SHAP values for the personalized physiological age (PPA) estimation. Deviation of PPA from chronological age is therefore the sum of the contextualized SHAP contributions of all the laboratory variables for a given subject (PPA deviation). Partial dependence plots and heatmaps of SHAP values also identify the precise range of biological values and thresholds for each variable and age group delineating accelerated or reduced aging. Clustering of SHAP values identifies specific PPA profiles. Finally, using recursive feature elimination, the list of variables was reduced to 26 biological variables without significant loss of model performance, providing a ready‐to‐use personalized and explainable model that is potentially clinically useful for monitoring physiological age to achieve healthy aging. PPA deviation was validated as a predictor of lifespan but also a risk factor for chronic diseases.
FIGURE 2
FIGURE 2
Model selection of different classes of machine learning models. (a) Several classes of models were tested to estimate physiological age, defined as the chronological age predicted by the model. An optimization of the hyperparameters of each model was performed on the training dataset, and the final achieved performance tested on the training and test datasets (coefficient of determination R 2 and mean absolute error MAE). MultiLayer Perceptron MLP and XGBoost model achieved the best performances. (b) Graphical representation of the predicted physiological age defined using MLP, XGBoost and XGBoost with Custom loss as function of chronological age. The red line highlights situations where physiological age is identical to chronological age. Custom loss applied to XGBoost improved XGBoost, by moderating the performance discrepancy across the age groups.
FIGURE 3
FIGURE 3
Global and contextualized explainability of physiological age. (a) Global explainability of the PPA model for the top‐20 most important variables (in order of importance based on the mean of absolute SHAP values). Each point color encodes the SHAP value of each variable for each individual; red and blue colors indicate high and low values of the variable, respectively. A positive or negative SHAP value on the x‐axis means that the variable contributed to the positive or negative estimation of physiological age for a given individual. The evolution of the raw variable values over time is depicted as a black line to the right of each variable name. This shows that the evolution of the SHAP values over time does not always follow the evolution of its raw value. (b) Contextualized explainability of the physiological age. SHAP values have been contextualized, taking as a base value the mean predicted age of the individuals with the same chronological age. Heatmap represents the mean of the absolute contextualized SHAP values for each variable (the whiter the color, the higher the mean absolute SHAP value) for each chronological age.
FIGURE 4
FIGURE 4
Partial Dependence Plots of contextualized SHAP values. (a) Contextualized SHAP values as a function of variable values for the top‐8 variables. Each dot represents an individual. The color indicates the corresponding chronological age (scale on the right). X‐axis corresponds to the real value of the variable, while the y‐axis corresponds to the SHAP value given to this individual for this variable. The dotted line corresponds to a SHAP value of 0, which means that when the individual displays a variable value for which the SHAP value is 0, the variable has no impact on the physiological age. (b) Heatmap of contextualized SHAP values as a function of chronological age. The color of each pixel indicates the average SHAP value of a variable (x‐axis) as a function of chronological age (y‐axis). An example of interpretation is illustrated in Figure S3.
FIGURE 5
FIGURE 5
Clustering SHAP values to reveal healthy aging trajectories. Individuals were clustered by agglomerative clustering based on their contextualized SHAP values. Chronological age was not added as a clustering variable (a) UMAP 2D‐projections were colored by chronological age, identified cluster and sum of contextualized SHAP values from left to right, respectively. It is thus possible to see, according to the age distribution of the different clusters, profiles of individuals with accelerated aging. (b) Signature of each cluster for the 24 variables allowing significant distinction between at least 2 clusters. The heatmap shows the average value of each variable for each cluster. (c) Decision plot profile for each cluster. Starting from the bottom, the cumulative contribution of each variable was presented (in positive and negative values) to the predicted final value (at the top of the diagram). For each cluster, we indeed have the “average” individual representative of the cluster.
FIGURE 6
FIGURE 6
Generation of a minimal model to estimate physiological age (RFE model). (a) Evolution of XGBoost custom loss model performance (R 2 and MAE scores) through recursive feature elimination (RFE). A model with 26 variables seems sufficient without significantly altering the model performance. Global explainability of the PPA model. (b) Graphical representation of the predicted physiological age defined by the RFE model (based on XGBoost with Custom loss) as a function of chronological age, on the train and test datasets. The red line indicates situations where physiological age is identical to chronological age. (c) Global explanation of the RFE model with the mean of absolute SHAP values in order of importance. Each point color encodes the SHAP value of each variable for each individual, red and blue colors for high and low values of the variable, respectively. On the x‐axis, a positive or negative SHAP value means that the variable for one individual contributes to a positive or negative estimation of physiological age relative to chronological age. (d) Heatmap of the mean of the absolute contextualized SHAP values for each variable (the whiter the color, the higher the mean absolute SHAP value) for each chronological age. (e, f) For a given individual, a personalized and contextualized explanation of physiological age wan be given. To the base value (mean predicted age of the individuals of the same chronological age), several contributions of each variable contextualized SHAP value were added to obtain the physiological age (increase of PPA in red, decrease of PPA in blue). (e) Example of an individual of 61 y.o predicted 49, (f) and an individual of 64 y.o. predicted 76.

References

    1. Ahadi, S. , Zhou, W. , Schüssler‐Fiorenza Rose, S. M. , Sailani, M. R. , Contrepois, K. , Avina, M. , Ashland, M. , Brunet, A. , & Snyder, M. (2020). Personal aging markers and ageotypes revealed by deep longitudinal profiling. Nature Medicine, 26, 83–90. - PMC - PubMed
    1. Amann, J. , Blasimme, A. , Vayena, E. , Frey, D. , Madai, V. I. , & Precise4Q consortium . (2020). Explainability for artificial intelligence in healthcare: A multidisciplinary perspective. BMC Medical Informatics and Decision Making, 20, 310. - PMC - PubMed
    1. Beard, J. R. , Officer, A. , de Carvalho, I. A. , Sadana, R. , Pot, A. M. , Michel, J.‐P. , Lloyd‐Sherlock, P. , Epping‐Jordan, J. E. , Geeske Peeters, G. M. E. E. , Mahanani, W. R. , Thiyagarajan, J. A. , & Chatterji, S. (2016). The world report on ageing and health: A policy framework for healthy ageing. The Lancet, 387, 2145–2154. - PMC - PubMed
    1. Bi, Q. , Goodman, K. E. , Kaminsky, J. , & Lessler, J. (2019). What is machine learning? A primer for the epidemiologist. American Journal of Epidemiology, 188, 2222–2239. - PubMed
    1. Cohen, A. A. , Milot, E. , Li, Q. , Bergeron, P. , Poirier, R. , Dusseault‐Bélanger, F. , Fülöp, T. , Leroux, M. , Legault, V. , Metter, E. J. , Fried, L. P. , & Ferrucci, L. (2015). Detection of a novel, integrative aging process suggests complex physiological integration. PLoS One, 10, e0116489. - PMC - PubMed

Publication types

LinkOut - more resources