

An extended period of elevated influenza mortality risk follows the main waves of influenza pandemics
- PMID: 37301110
- PMCID: PMC7614920
- DOI: 10.1016/j.socscimed.2023.115975
An extended period of elevated influenza mortality risk follows the main waves of influenza pandemics
Abstract
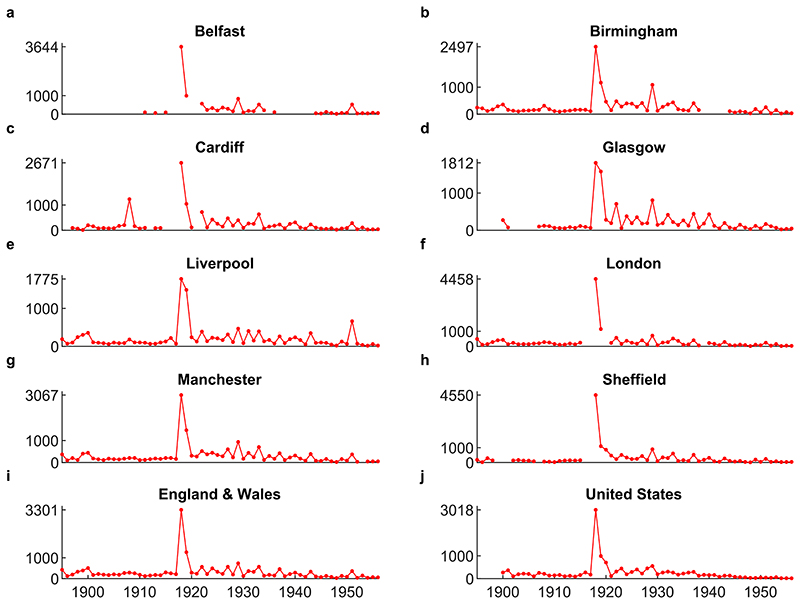
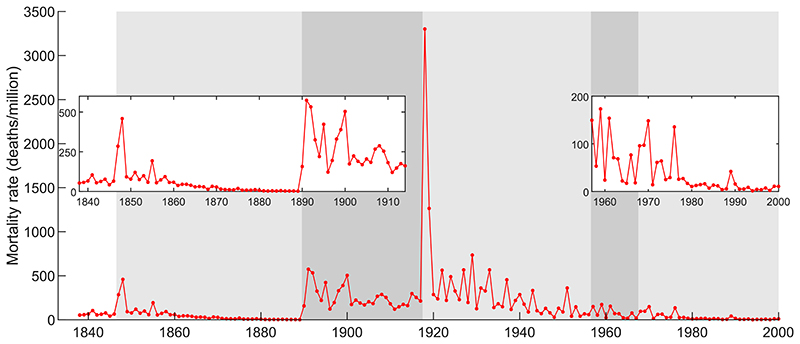
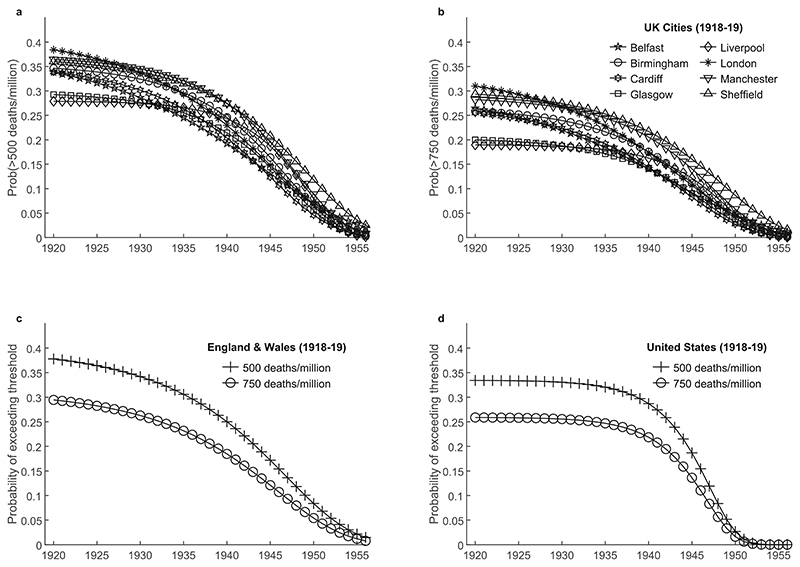
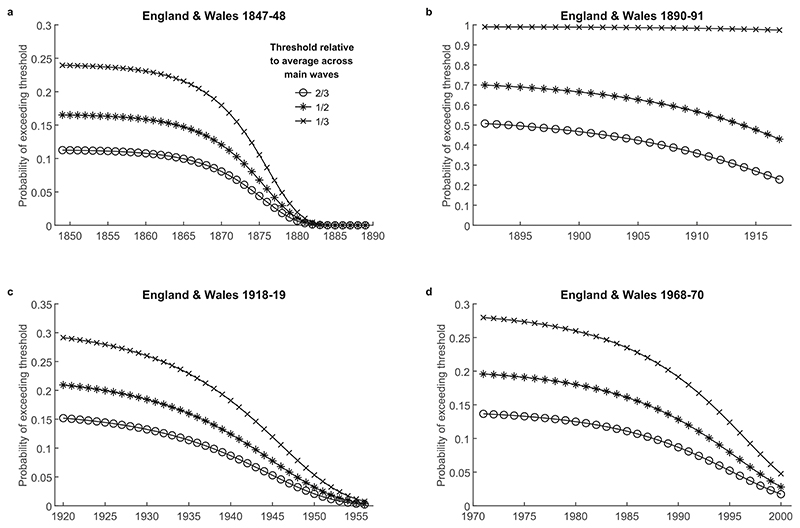
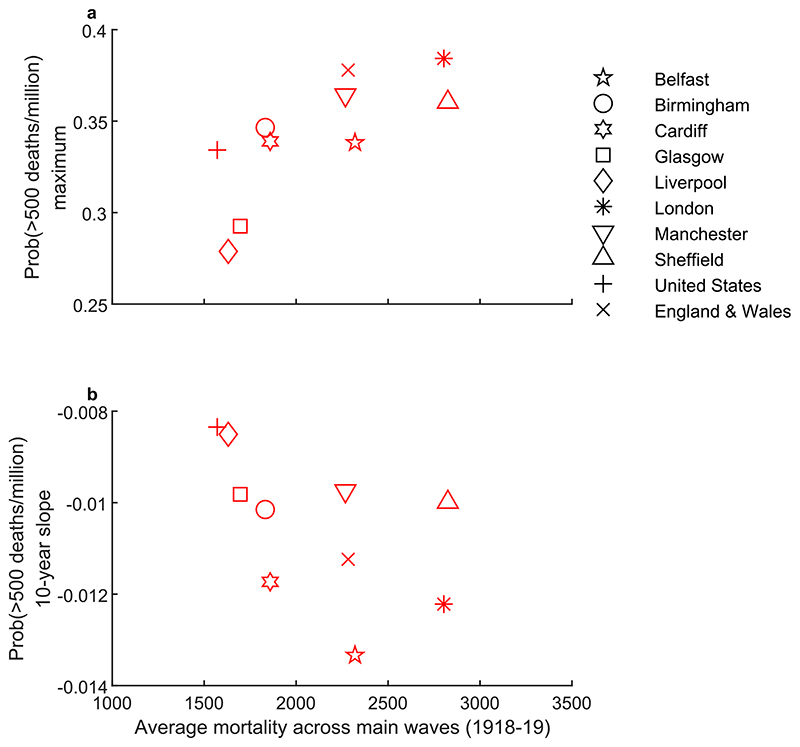
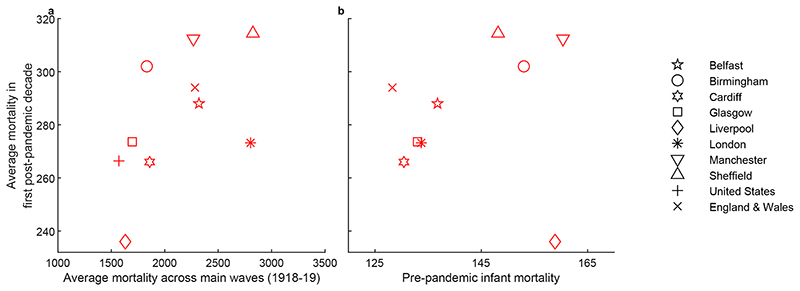
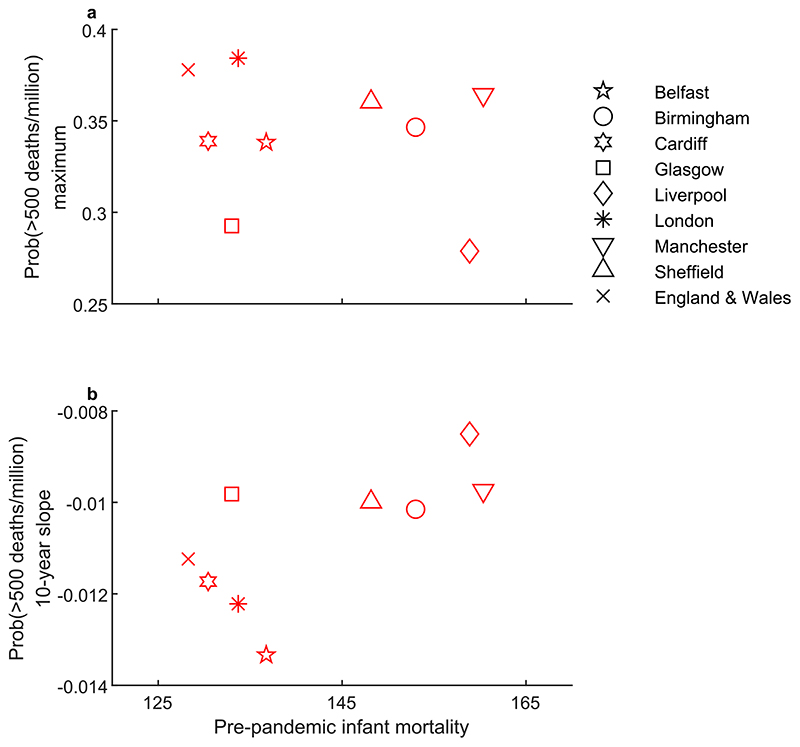
Understanding the extent and evolution of pandemic-induced mortality risk is critical given its wide-ranging impacts on population health and socioeconomic outcomes. We examine empirically the persistence and scale of influenza mortality risk following the main waves of influenza pandemics, a quantitative analysis of which is required to understand the true scale of pandemic-induced risk. We provide evidence from municipal public health records that multiple recurrent outbreaks followed the main waves of the 1918-19 pandemic in eight large cities in the UK, a pattern we confirm using data for the same period in the US and data for multiple influenza pandemics during the period 1838-2000 in England and Wales. To estimate the persistence and scale of latent post-pandemic influenza mortality risk, we model the stochastic process of mortality rates as a sequence of bounded Pareto distributions whose tail indexes evolves over time. Consistently across pandemics and locations, we find that influenza mortality risk remains elevated for around two decades after the main pandemic waves before more rapid convergence to background influenza mortality, amplifying the impact of pandemics. Despite the commonality in duration, there is heterogeneity in the persistence and scale of risk across the cities, suggesting effects of both immunity and socioeconomic conditions.
Keywords: Influenza pandemics; Mortality risk dynamics; Post-pandemic period.
Copyright © 2023 The Authors. Published by Elsevier Ltd.. All rights reserved.
Conflict of interest statement
Declaration of competing interest The authors declare no conflicts of interest.
Figures
Similar articles
-
The influence of changing host immunity on 1918-19 pandemic dynamics.Epidemics. 2014 Sep;8:18-27. doi: 10.1016/j.epidem.2014.07.004. Epub 2014 Aug 8. Epidemics. 2014. PMID: 25240900
-
Understanding mortality in the 1918-1919 influenza pandemic in England and Wales.Influenza Other Respir Viruses. 2011 Mar;5(2):89-98. doi: 10.1111/j.1750-2659.2010.00186.x. Epub 2010 Nov 3. Influenza Other Respir Viruses. 2011. PMID: 21306572 Free PMC article.
-
Changes in severity of 2009 pandemic A/H1N1 influenza in England: a Bayesian evidence synthesis.BMJ. 2011 Sep 8;343:d5408. doi: 10.1136/bmj.d5408. BMJ. 2011. PMID: 21903689 Free PMC article.
-
The use of mathematical models to inform influenza pandemic preparedness and response.Exp Biol Med (Maywood). 2011 Aug;236(8):955-61. doi: 10.1258/ebm.2010.010271. Epub 2011 Jul 4. Exp Biol Med (Maywood). 2011. PMID: 21727183 Free PMC article. Review.
-
[Influenza pandemic deaths in Germany from 1918 to 2009. Estimates based on literature and own calculations].Bundesgesundheitsblatt Gesundheitsforschung Gesundheitsschutz. 2016 Apr;59(4):523-36. doi: 10.1007/s00103-016-2324-9. Bundesgesundheitsblatt Gesundheitsforschung Gesundheitsschutz. 2016. PMID: 26984565 Review. German.
Cited by
-
Will COVID-19 become mild, like a cold?Epidemiol Infect. 2024 Oct 7;152:e120. doi: 10.1017/S0950268824001110. Epidemiol Infect. 2024. PMID: 39370682 Free PMC article. Review.
References
-
- Aiyagari SR. Uninsured idiosyncratic risk and aggregate saving. Q J Econ. 1994;109(3):659–684.
-
- Almond D. Is the 1918 influenza pandemic over? Long-term effects of in utero influenza exposure in the post-1940 U.S. population. J Polit Econ. 2006;114(4):672–712. doi: 10.1086/507154. - DOI
-
- Anderson RM, May RM. Infectious Diseases of Humans: Dynamics and Control. Oxford Science Publications; 1992.
Publication types
MeSH terms
Grants and funding
LinkOut - more resources
Full Text Sources
Medical
