. 2023 Jun 20;4(6):101072.
doi: 10.1016/j.xcrm.2023.101072. Epub 2023 Jun 9.

Targeting cytokine-like protein FAM3D lowers blood pressure in hypertension

Affiliations

Targeting cytokine-like protein FAM3D lowers blood pressure in hypertension

Yicong Shen et al. Cell Rep Med. .

Abstract

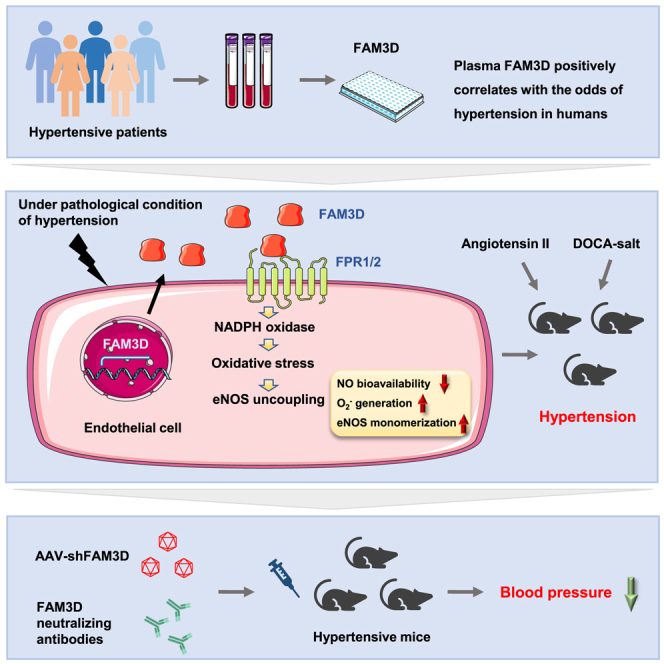
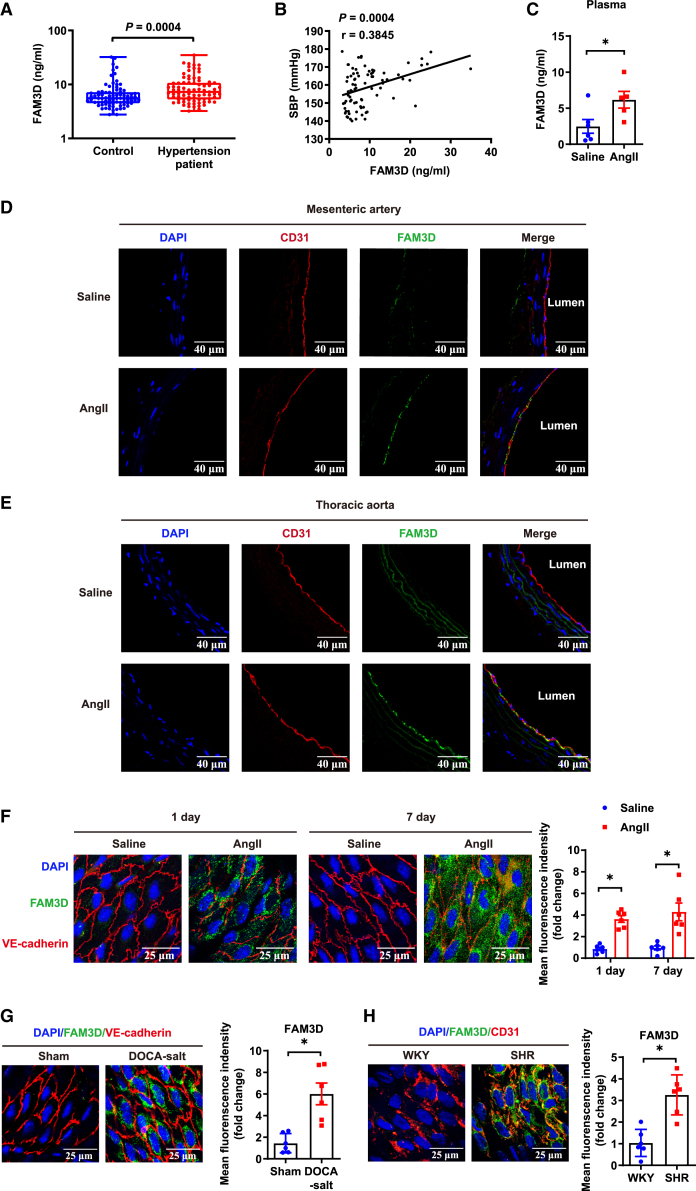
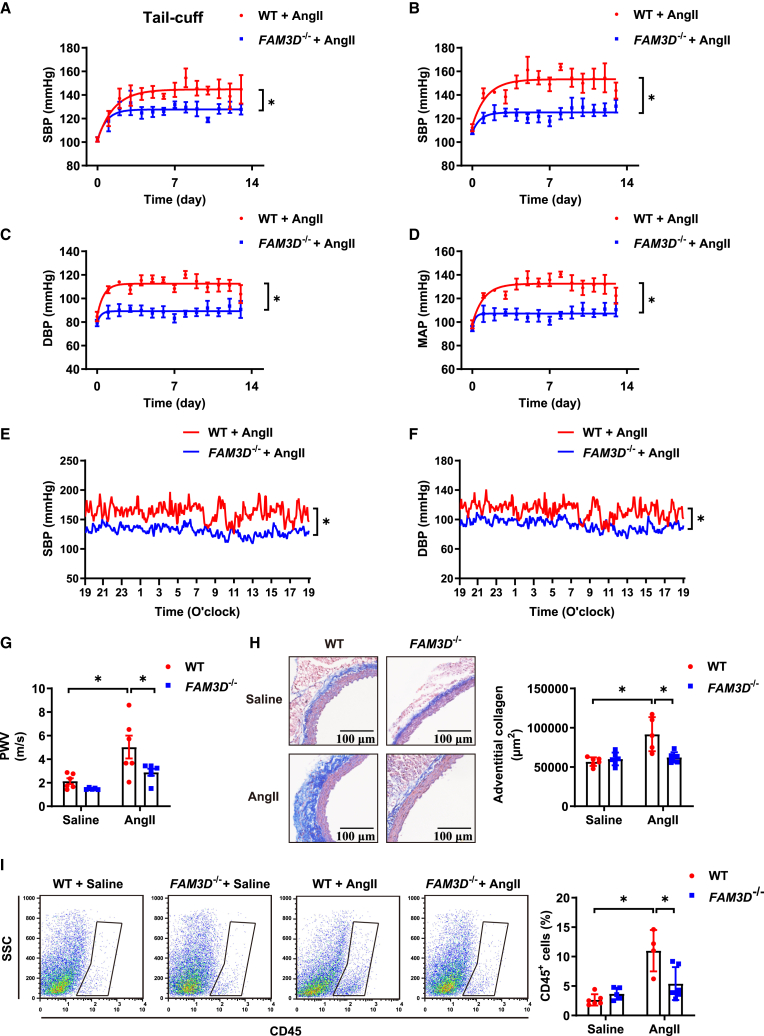
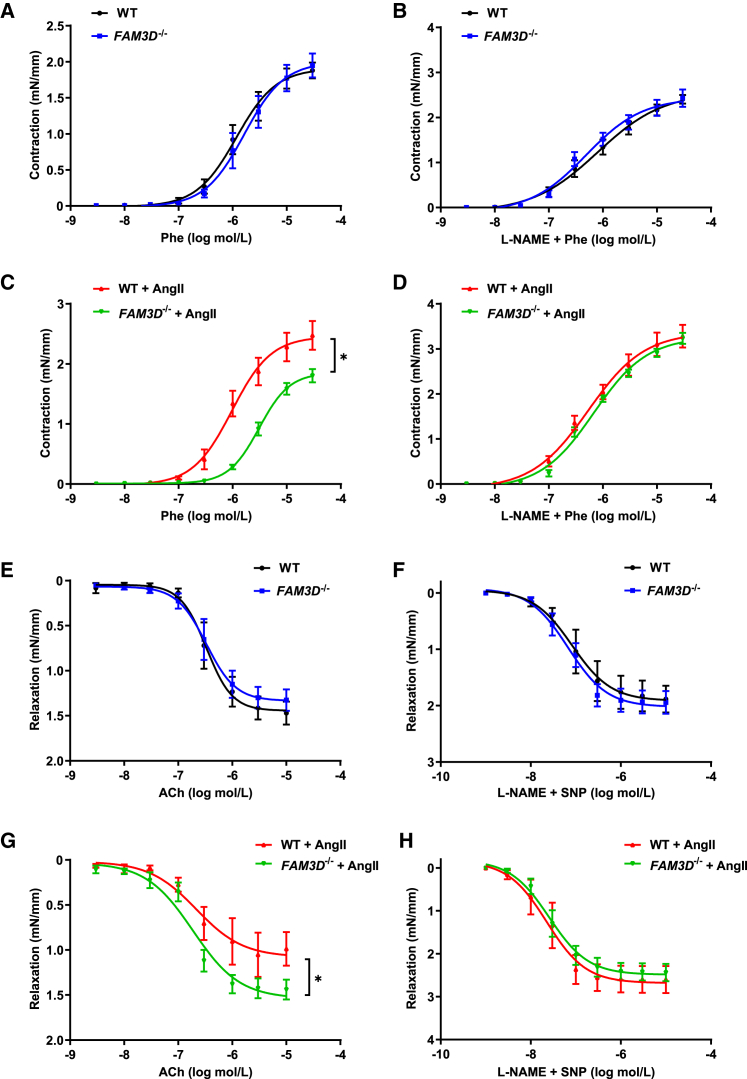
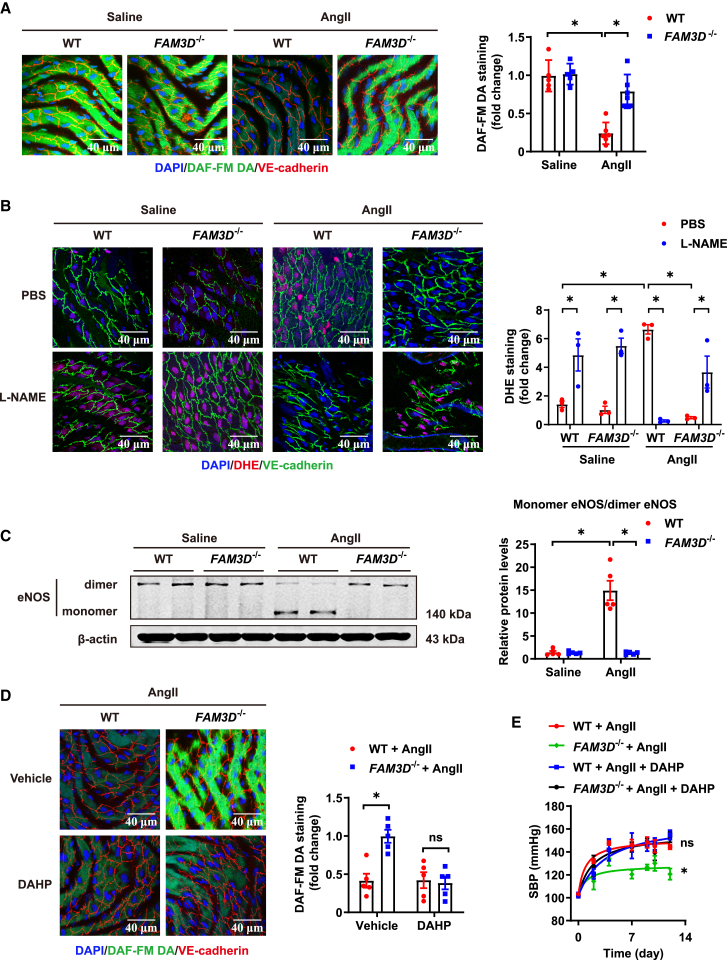
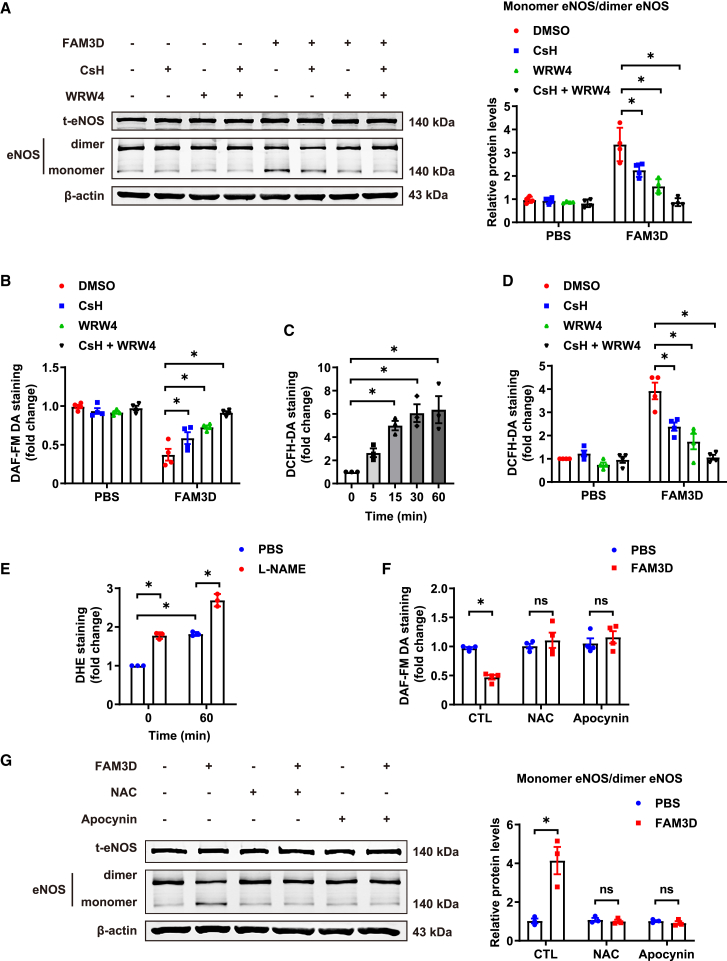
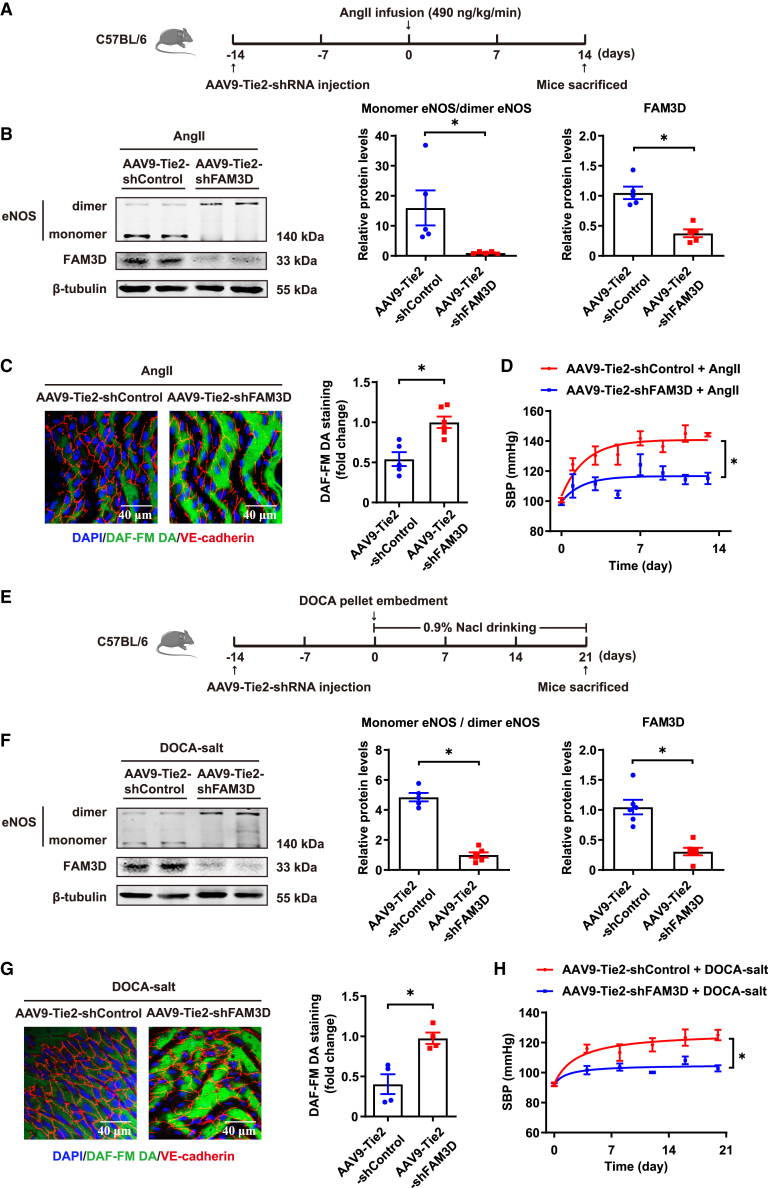
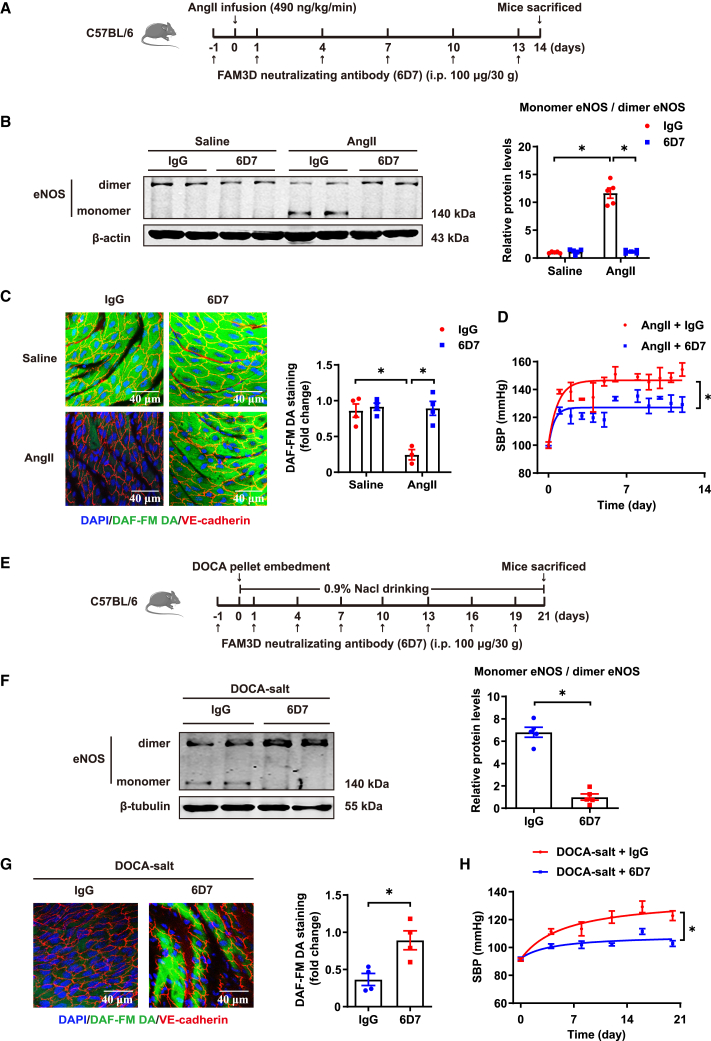
Current antihypertensive options still incompletely control blood pressure, suggesting the existence of uncovered pathogenic mechanisms. Here, whether cytokine-like protein family with sequence similarity 3, member D (FAM3D) is involved in hypertension etiology is evaluated. A case-control study exhibits that FAM3D is elevated in patients with hypertension, with a positive association with odds of hypertension. FAM3D deficiency significantly ameliorates angiotensin II (AngII)-induced hypertension in mice. Mechanistically, FAM3D directly causes endothelial nitric oxide synthase (eNOS) uncoupling and impairs endothelium-dependent vasorelaxation, whereas 2,4-diamino-6-hydroxypyrimidine to induce eNOS uncoupling abolishes the protective effect of FAM3D deficiency against AngII-induced hypertension. Furthermore, antagonism of formyl peptide receptor 1 (FPR1) and FPR2 or the suppression of oxidative stress blunts FAM3D-induced eNOS uncoupling. Translationally, targeting endothelial FAM3D by adeno-associated virus or intraperitoneal injection of FAM3D-neutralizing antibodies markedly ameliorates AngII- or deoxycorticosterone acetate (DOCA)-salt-induced hypertension. Conclusively, FAM3D causes eNOS uncoupling through FPR1- and FPR2-mediated oxidative stress, thereby exacerbating the development of hypertension. FAM3D may be a potential therapeutic target for hypertension.

Keywords: FAM3D; antihypertensive treatment; endothelial dysfunction; hypertension.


Conflict of interest statement

Declaration of interests The authors declare no competing interests.

Figures

None
Graphical abstract
Figure 1
Figure 1
The elevation of FAM3D correlates with the pathogenesis of hypertension (A) ELISA measurement of plasma FAM3D from individuals in the case-control study. N = 80 pairs. Data are represented as mean ± SEM. Mann-Whitney test. (B) Spearman correlation analysis of plasma FAM3D levels and SBP in patients with hypertension. N = 80. (C) ELISA measurement of plasma FAM3D levels in C57BL/6 mice treated with saline or AngII for 7 days. n = 5–6. Data are represented as mean ± SEM. Unpaired Student’s t test, ∗p < 0.05. (D and E) Immunofluorescent staining of FAM3D in mesenteric arteries (E) and thoracic aortas (F) from C57BL/6 mice after saline or AngII infusion for 7 days. Scale bar, 40 μm. (F) Immunofluorescent en face staining of FAM3D in the endothelial layer of thoracic aortas of C57BL/6 mice after saline or AngII infusion for 1 day or 7 days. Scale bar, 25 μm. n = 6. Data are represented as mean ± SEM. Unpaired Student’s t test, ∗p < 0.05. (G) Immunofluorescent en face staining of FAM3D in the endothelial layer of thoracic aortas of sham-treated or DOCA-salt-induced mice. Scale bar, 25 μm. n = 6. Data are represented as mean ± SEM. Unpaired Student’s t test, ∗p < 0.05. (H) Immunofluorescent en face staining of FAM3D in the endothelial layer of thoracic aortas of Wistar-Kyoto (WKY) or SHRs. Scale bar, 25 μm. n = 6. Data are represented as mean ± SEM. Unpaired Student’s t test, ∗p < 0.05.
Figure 2
Figure 2
FAM3D deficiency ameliorates AngII-induced hypertension and related vascular pathologies (A) SBP of WT and FAM3D−/− mice was measured by the tail-cuff method during AngII infusion for 14 days. n = 6–8. Data are represented as mean ± SEM. Repeated-measures analysis using a mixed-effects model, ∗p < 0.05. (B–D) The SBP (B), DBP (C), and MAP (D) of WT and FAM3D−/− mice were measured by radiotelemetry during AngII infusion for 14 days. n = 5–6. Data are represented as mean ± SEM. Repeated-measures analysis using a mixed-effects model, ∗p < 0.05. (E and F) 24-h recordings of SBP (E) and DBP (F) in WT and FAM3D−/− mice was measured by radiotelemetry following 7 days of AngII infusion. n = 3–5. Data are represented as mean ± SEM. Repeated-measures analysis using a mixed-effects model, ∗p < 0.05. (G) Pulse wave velocity (PWV) in aortas from WT and FAM3D−/− mice treated with saline or AngII for 14 days. n = 5–6. Data are represented as mean ± SEM. Two-way ANOVA followed by Tukey’s multiple comparisons test, ∗p < 0.05. (H) Representative Masson staining and quantification of adventitial collagen deposition in thoracic aortas from WT and FAM3D−/− mice treated with saline or AngII for 14 days. Scale bar, 100 μm. n = 5–6. Data are represented as mean ± SEM. Two-way ANOVA followed by Tukey’s multiple comparisons test, ∗p < 0.05. (I) Flow cytometric analysis of CD45+ cells in aortas from WT and FAM3D−/− mice treated with saline or AngII for 14 days. n = 4–6. Data are represented as mean ± SEM. Two-way ANOVA followed by Tukey’s multiple comparisons test, ∗p < 0.05.
Figure 3
Figure 3
FAM3D impairs endothelium-dependent vasorelaxation to further enhance vasocontraction (A and B) Concentration-response curves of endothelium-dependent contraction (A) and endothelium-independent contraction (B) of mesenteric resistance arteries from WT and FAM3D−/− mice. n = 6. Data are represented as mean ± SEM. Two-way ANOVA followed by Tukey’s multiple comparisons test. (C and D) Concentration-response curves of endothelium-dependent contraction (C) and endothelium-independent contraction (D) of mesenteric resistance arteries from WT and FAM3D−/− mice infused with AngII for 14 days. n = 6. Data are represented as mean ± SEM. Two-way ANOVA followed by Tukey’s multiple comparisons test. ∗p < 0.05. (E and F) Concentration-response curves of endothelium-dependent relaxation (E) and endothelium-independent relaxation (F) of mesenteric resistance arteries from WT and FAM3D−/− mice. n = 5–6. Data are represented as mean ± SEM. Two-way ANOVA by Tukey’s multiple comparisons test. (G and H) Concentration-response curves of endothelium-dependent relaxation (G) and endothelium-independent relaxation (H) of mesenteric arteries from WT and FAM3D−/− mice infused with AngII for 14 days. n = 6. Data are represented as mean ± SEM. Two-way ANOVA by Tukey’s multiple comparisons test. ∗p < 0.05.
Figure 4
Figure 4
FAM3D deficiency inhibits AngII-induced eNOS uncoupling in ECs of aortas in mice (A) Representative DAF-FM DA en face staining and quantification of NO levels in ECs from the thoracic aortas of WT and FAM3D−/− mice after saline or AngII infusion for 14 days. n = 5–6. Data are represented as mean ± SEM. Two-way ANOVA followed by Tukey’s multiple comparisons test, ∗p < 0.05. (B) Representative DHE en face staining and quantification of O2 in ECs from thoracic aortas in WT and FAM3D−/− mice infused with saline or AngII for 14 days. L-NAME (200 μmol/L) was ex vivo used to treat dissected aortas for 30 min before DHE staining. n = 3. Data are represented as mean ± SEM. Two-way ANOVA followed by Tukey’s multiple comparisons test, ∗p < 0.05. (C) Representative western blot analysis and quantification of monomer/dimer eNOS ratios in the aortas of WT and FAM3D−/− mice treated with saline or AngII for 14 days. n = 5. Data are represented as mean ± SEM. Two-way ANOVA followed by Tukey’s multiple comparisons test, ∗p < 0.05. (D) Representative DAF-FM DA en face staining and quantification of NO in ECs from the thoracic aortas of WT and FAM3D−/− mice infused with AngII and administered with or without 2,4- DAHP (10 mmol/L) in drinking water for 14 days. n = 5. Data are represented as mean ± SEM. Two-way ANOVA followed by Tukey’s multiple comparisons test, ∗p < 0.05. (E) SBP was measured by the tail-cuff method in WT and FAM3D−/− mice infused with AngII and administered with or without DAHP (10 mmol/L) in drinking water for 14 days. n = 4–5. Data are represented as mean ± SEM. Repeated-measures analysis using a mixed-effects model followed by Tukey’s multiple comparisons test, ∗p < 0.05, WT + AngII vs. FAM3D−/− + AngII; ns, no significance, WT + AngII + DAHP vs. FAM3D−/− + AngII + DAHP.
Figure 5
Figure 5
FAM3D causes eNOS uncoupling through FPR1/2-mediated oxidative stress (A) Representative western blot and quantification of monomer/dimer eNOS ratios in HUVECs treated with FAM3D (10 nmol/L) for 6 h after preincubation with CsH (1 μmol/L) and/or WRW4 (1 μmol/L) for 2 h. n = 4. Data are represented as mean ± SEM. Two-way ANOVA followed by Tukey’s multiple comparisons test, ∗p < 0.05. (B) Quantification of intracellular NO by DAF-FM DA staining in human umbilical vein ECs (HUVECs) treated with FAM3D (10 nmol/L) for 6 h after preincubation with CsH (1 μmol/L) and/or WRW4 (1 μmol/L) for 2 h. n = 4. Data are represented as mean ± SEM. Two-way ANOVA followed by Tukey’s multiple comparisons test, ∗p < 0.05. (C) Quantification of ROS by DCFH-DA staining in HUVECs treated with FAM3D (10 nmol/L) for various times. n = 3. Data are represented as mean ± SEM. One-way ANOVA followed by Dunnett’s multiple comparisons test, ∗p < 0.05. (D) Quantification of ROS by DCFH-DA staining in HUVECs treated with FAM3D (10 nmol/L) for 60 min after preincubation with CsH (1 μmol/L) and/or WRW4 (1 μmol/L) for 2 h. n = 4. Data are represented as mean ± SEM. Two-way ANOVA followed by Tukey’s multiple comparisons test, ∗p < 0.05. (E) Quantification of O2 generation by DHE staining in HUVECs treated with FAM3D (10 nmol/L) in the presence or absence of L-NAME (200 μmol/L) for 60 min. n = 3. Data are represented as mean ± SEM. Two-way ANOVA followed by Tukey’s multiple comparisons test, ∗p < 0.05. (F) Quantification of intracellular NO by DAF-FM DA staining in HUVECs treated with FAM3D (10 nmol/L) for 6 h after preincubation with NAC (5 mmol/L) or apocynin (100 μmol/L) for 4 h. n = 4. Data are represented as mean ± SEM. Two-way ANOVA followed by Sidak’s multiple comparisons test, ∗p < 0.05. (G) Representative western blot and quantification of monomer/dimer eNOS radios in HUVECs treated with FAM3D (10 nmol/L) for 6 h after preincubation with NAC (5 mmol/L) or apocynin (100 μmol/L) for 4 h. n = 3. Data are represented as mean ± SEM. Two-way ANOVA followed by Sidak’s multiple comparisons test, ∗p < 0.05.
Figure 6
Figure 6
Endothelial FAM3D knockdown alleviates AngII- and DOCA-salt-induced hypertension in mice (A) Schematic diagram showing the injection of AAV9-Tie2-shRNA (shFAM3D or shControl, 5 × 1011 v.g./mice) via tail veins followed by 14 days of AngII induction in C57BL/6 mice. (B) Representative western blot and quantification of monomer/dimer eNOS ratios and FAM3D in the aortas of C57BL/6 mice infected with AAV9-Tie2-shControl or AAV9-Tie2-shFAM3D followed by AngII infusion for 14 days. n = 5–6. Data are represented as mean ± SEM. Unpaired Student’s t test, ∗p < 0.05. (C) Representative DAF-FM DA en face staining and quantification of NO in ECs from the thoracic aortas of C57BL/6 mice infected with AAV9-Tie2-shControl or AAV9-Tie2-shFAM3D followed by AngII infusion for 14 days. n = 5. Data are represented as mean ± SEM. Unpaired Student’s t test, ∗p < 0.05. (D) SBP of C57BL/6 mice infected with AAV9-Tie2-shControl or AAV9-Tie2-shFAM3D followed by AngII infusion for 14 days. n = 5–6. Data are represented as mean ± SEM. Repeated-measures analysis using a mixed-effects model, ∗p < 0.05. (E) Schematic diagram showing the injection of AAV9-Tie2-shRNA (shFAM3D or shControl, 5 × 1011 v.g./mice) via tail veins followed by 21 days of DOCA-salt treatment in C57BL/6 mice. (F) Representative western blot and quantification of monomer/dimer eNOS ratios and FAM3D in the aortas of C57BL/6 mice infected with AAV9-Tie2-shControl or AAV9-Tie2-shFAM3D followed by DOCA-salt treatment for 21 days. n = 5–6. Data are represented as mean ± SEM. Unpaired Student’s t test, ∗p < 0.05. (G) Representative DAF-FM DA en face staining and quantification of NO in ECs from the thoracic aortas of C57BL/6 mice infected with AAV9-Tie2-shControl or AAV9-Tie2-shFAM3D followed by DOCA-salt treatment for 21 days. n = 4. Data are represented as mean ± SEM. Unpaired Student’s t test, ∗p < 0.05. (H) SBP of C57BL/6 mice infected with AAV9-Tie2-shControl or AAV9-Tie2-shFAM3D followed by DOCA-salt treatment for 21 days. n = 6. Data are represented as mean ± SEM. Repeated-measures analysis using a mixed-effects model, ∗p < 0.05.
Figure 7
Figure 7
The FAM3D-neutralizing antibodies ameliorate AngII- and DOCA-salt-induced hypertension in mice (A) Schematic diagram showing the administration of the FAM3D-neutralizing antibodies (6D7) or mouse IgG (100 μg/30 g) to C57BL/6 mice during 14 days of AngII infusion. (B) Representative western blot and quantification of monomer/dimer eNOS ratios in the aortas of C57BL/6 mice that were intraperitoneally injected with mouse IgG or 6D7 during AngII infusion for 14 days. n = 5. Data are represented as mean ± SEM. Two-way ANOVA followed by Tukey’s multiple comparisons test, ∗p < 0.05. (C) Representative DAF-FM DA en face staining and quantification of NO in ECs from the thoracic aortas of C57BL/6 mice that were intraperitoneally injected with mouse IgG or 6D7 during AngII infusion for 14 days. n = 3–4. Data are represented as mean ± SEM. Two-way ANOVA followed by Tukey’s multiple comparisons test, ∗p < 0.05. (D) SBP of C57BL/6 mice that were intraperitoneally injected with mouse IgG or 6D7 during AngII infusion for 14 days. n = 6–7. Data are represented as mean ± SEM. Repeated-measures analysis using a mixed-effects model, ∗p < 0.05. (E) Schematic diagram showing the administration of the 6D7 or mouse IgG (100 μg/30 g) to C57BL/6 mice during 21 days of DOCA-salt treatment. (F) Representative western blot and quantification of monomer/dimer eNOS ratios in the aortas of C57BL/6 mice that were intraperitoneally injected with mouse IgG or 6D7 during DOCA-salt treatment for 21 days. n = 5. Data are represented as mean ± SEM. Unpaired Student’s t test, ∗p < 0.05. (G) Representative DAF-FM DA en face staining and quantification of NO in ECs from the thoracic aortas of C57BL/6 mice that were intraperitoneally injected with mouse IgG or 6D7 during DOCA-salt treatment for 21 days. n = 4. Data are represented as mean ± SEM. Unpaired Student’s t test, ∗p < 0.05. (H) SBP of C57BL/6 mice that were intraperitoneally injected with mouse IgG or 6D7 during DOCA-salt treatment for 21 days. n = 6. Data are represented as mean ± SEM. Repeated-measures analysis using a mixed-effects model, ∗p < 0.05.

References

    1. Oparil S., Acelajado M.C., Bakris G.L., Berlowitz D.R., Cífková R., Dominiczak A.F., Grassi G., Jordan J., Poulter N.R., Rodgers A., Whelton P.K. Hypertension. Nat. Rev. Dis. Prim. 2018;4 - PMC - PubMed
    1. Harrison D.G., Coffman T.M., Wilcox C.S. Pathophysiology of hypertension: the mosaic theory and beyond. Circ. Res. 2021;128:847–863. - PMC - PubMed
    1. Oparil S., Schmieder R.E. New approaches in the treatment of hypertension. Circ. Res. 2015;116:1074–1095. - PubMed
    1. Gallo G., Volpe M., Savoia C. Endothelial dysfunction in hypertension: current concepts and clinical implications. Front. Med. 2021;8 - PMC - PubMed
    1. Ambrosino P., Bachetti T., D'Anna S.E., Galloway B., Bianco A., D'Agnano V., Papa A., Motta A., Perrotta F., Maniscalco M. Mechanisms and clinical implications of endothelial dysfunction in arterial hypertension. J. Cardiovasc. Dev. Dis. 2022;9 - PMC - PubMed

Publication types