. 2023 Jul 11;56(7):1681-1698.e13.
doi: 10.1016/j.immuni.2023.05.009. Epub 2023 Jun 9.

HLA-II immunopeptidome profiling and deep learning reveal features of antigenicity to inform antigen discovery

Affiliations

HLA-II immunopeptidome profiling and deep learning reveal features of antigenicity to inform antigen discovery

Martin Stražar et al. Immunity. .

Abstract

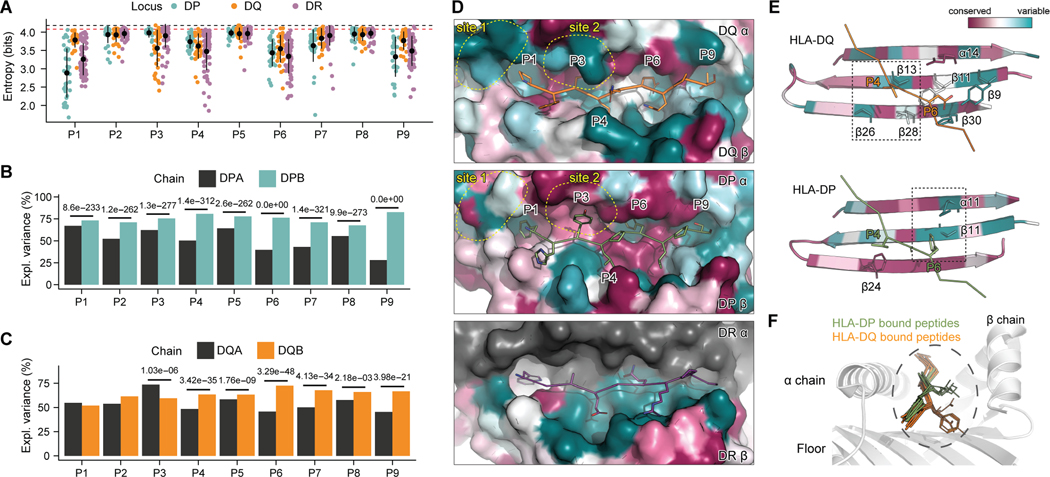
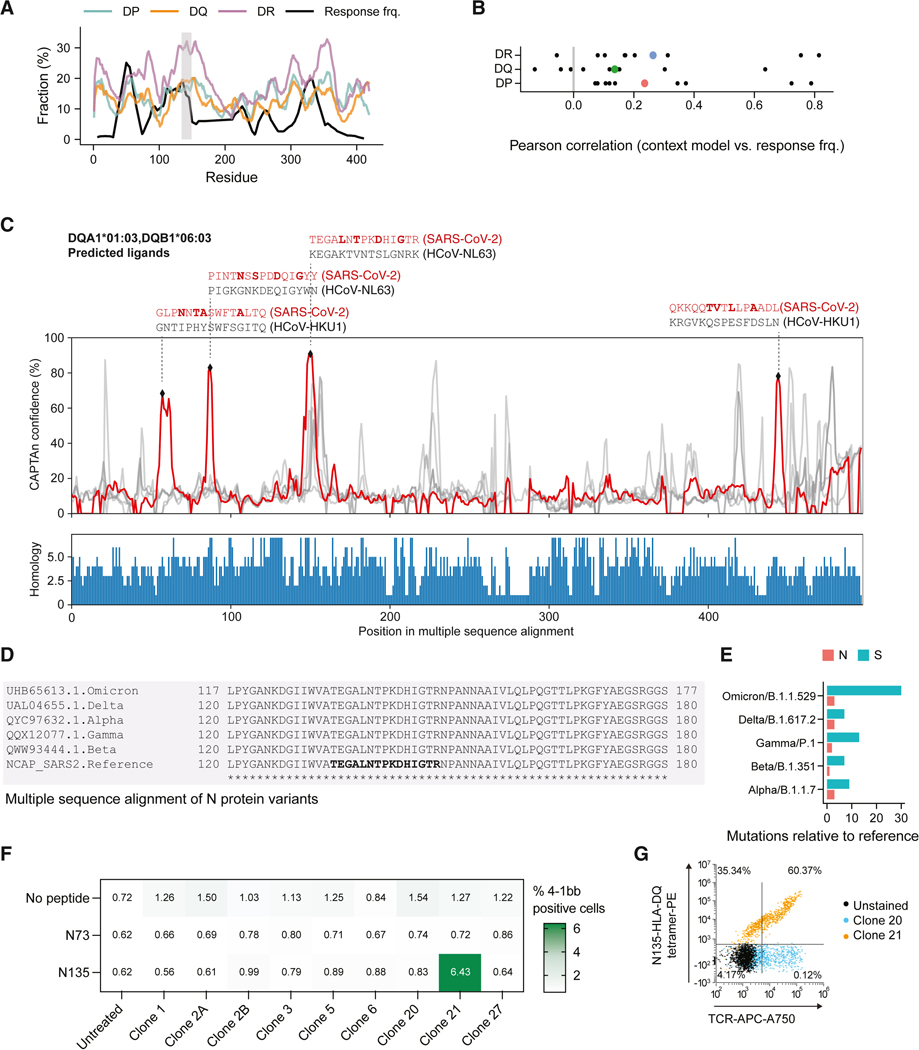
CD4+ T cell responses are exquisitely antigen specific and directed toward peptide epitopes displayed by human leukocyte antigen class II (HLA-II) on antigen-presenting cells. Underrepresentation of diverse alleles in ligand databases and an incomplete understanding of factors affecting antigen presentation in vivo have limited progress in defining principles of peptide immunogenicity. Here, we employed monoallelic immunopeptidomics to identify 358,024 HLA-II binders, with a particular focus on HLA-DQ and HLA-DP. We uncovered peptide-binding patterns across a spectrum of binding affinities and enrichment of structural antigen features. These aspects underpinned the development of context-aware predictor of T cell antigens (CAPTAn), a deep learning model that predicts peptide antigens based on their affinity to HLA-II and full sequence of their source proteins. CAPTAn was instrumental in discovering prevalent T cell epitopes from bacteria in the human microbiome and a pan-variant epitope from SARS-CoV-2. Together CAPTAn and associated datasets present a resource for antigen discovery and the unraveling genetic associations of HLA alleles with immunopathologies.

Keywords: CD4(+) T cells; MHC class II; SARS-CoV-2 antigens; antigen presentation; immunopeptidomics; microbiome antigens; protein sequence models.


Conflict of interest statement

Declaration of interests R.J.X. is a co-founder of Celsius Therapeutics and Jnana Therapeutics, a member of the Scientific Advisory Board at Nestle, and a member of the Board of Directors at Moonlake Immunotherapeutics. S.A.C. is a member of the scientific advisory boards of Kymera, PTM BioLabs, Seer, and PrognomIQ.

Figures

Figure 1.
Figure 1.. Monoallelic profiling of the HLA-II peptidome recovers thousands of peptides.
A. Schematic of immunopeptidomics workflow. Monoallelic peptidomics profiling in Expi293F cells expressing individual StrepII-tagged HLA-II heterodimers. For HLA-DQ and HLA-DP heterodimers, HLA-DQA1−/− and HLA-DPB1−/− Expi293F cells were leveraged to prevent heterodimer pairing with endogenous alpha chains. B. Quantified flow-cytometry data showing surface and total cell expression (intracellular stain) of HLA-II heterodimers used in immunopeptidomics experiments. HLA-DP was expressed in HLA-DPB1−/− cells. HLA-DQ and HLA-DR were expressed in WT Expi293F cells. Percentage of relative positive cells were normalized to DPA1*02:01, DPB1*17:01, DQA1*01:03, DQB1*06:03, or DRB1*11:01, respectively. C. Number of unique HLA-II binding peptides and de-nested peptides per HLA-II heterodimer. D. Length distribution density plot of unique peptides bound to HLA-II isotypes. See also Figure S1 and Table S1.
Figure 2.
Figure 2.. Clustering of HLA-II allele-specific peptide ligands reveals binding register motifs.
A-C. Catalog of peptide motif preferences from unique HLA-II ligand regions for 87 of the major HLA-DP, DQ and DR alleles. Euclidean distance-based clustering of primary motifs represented as amino acid probabilities at P1-P9 derived from unique binding cores. D. Example of HLA-II (gray cartoon) and peptide (ribbon) complex (PDB 3LQZ). Peptide is colored as a spectrum from the N-terminus (blue) to the C-terminus (red), and side chains are shown as sticks. HLA-II-bound peptides adopt an extended helical conformation resembling a polyproline helix type II (PPII), where the side chain of every third residue aligns in the same direction. Position of TCR bound to peptide-HLA-II is shown as a dashed line. E. Schematic of peptide-HLA-II-TCR interaction. Hydrogen bonds between peptide and HLA-II are shown as dotted lines, and TCR position is shown as a dashed line. The backbone of the stretched PPII peptide is conducive to forming hydrogen bonds with the conserved asparagine residues (Asn62α, Asn69α, and Asn82β) of HLA-II. Amino acid side chains at intervening positions can interact with HLA-II binding pockets. See also Figure S2.
Figure 3.
Figure 3.. HLA-II isotypes exhibit unique structural features that dictate peptide-binding specificity.
A. Entropy at P1-P9 for consensus binding cores of HLA-II heterodimers. Lower entropy at a given amino acid position in the peptide indicates preferential binding of specific amino acids. Dashed lines represent entropies across the entire human proteome (black) and the N-terminal residue in recovered ligands (red). HLA-DR heterodimers exhibit amino acid binding preferences at P1, P4, P6, and P9 anchor residues, while HLA-DP heterodimers exhibit preferences at P1, P6, and P9 and HLA-DQ heterodimers at P3 and P4. B-C. Explained variance of amino acid probabilities at P1-P9 given alpha and beta chains of HLA-DP and -DQ heterodimers and their consensus motifs (Dirichlet regression model, Methods). Binding specificity of both isotypes can largely be explained by the beta chain, with the notable exception of P3 for HLA-DQ with a significant contribution from the alpha chain. D. Surface representation of HLA-DP5 (PDB 3WEX), HLA-DQ (PDB 6PY2), and HLA-DR (PDB 3T0E) bound to a peptide (ribbon and stick). Sequence conservation among HLA-II genes reported in IMGT is estimated using the ConSurf server, showing highly conserved (maroon) and variable (turquoise) residues. Sites 1 and 2 of HLA-DQ are more variable than HLA-DP. The variation in HLA-DQ site 1 coincides with HLA-DM-interacting region, while site 2 interacts with P3 of the peptide, suggesting preferential interactions with the middle region at P3 and P4. E. HLA-DQ (top; PDB 4MAY) and HLA-DP (bottom) heterodimers exhibit variability within the floor of P4 and P6 pockets, respectively. Properties of HLA-DQ beta chain residues β26 and β28 determine P4 residue preferences. Properties of HLA-DP alpha chain residues α11 and β11 determine the width and specificity of the P6 pocket. Observed anchor pocket variability is correlated with the entropy shown in Fig. 3A, where HLA-DQ has lower entropy at P4 than HLA-DP and vice versa for P6. F. Comparison of position of HLA-II-bound peptides in the peptide binding groove. HLA-II heterodimer alpha chains were aligned, and one representative HLA-II (PDB 3LQZ) is shown. HLA-II-bound peptides are shown in ribbons, and side chains of P4 are shown as lines. The P4 binding pocket for HLA-DQ is deeper compared to HLA-DP, which has conserved Phe24β in the floor of the P4 binding pocket (as in Fig 3E). Deeper insertion of P4 side chains towards the groove results in a close positioning of P3 side chains with the HLA-DQ alpha chain. HLA-DQ peptides are from PDB entries 6PY2, 6MFF, 4GG6, 4MAY, 5KSA, 6U3N, and 1JK8. HLA-DP peptides are from PDB entries 3LQZ, 3WEX, 4P4K, 4P5K, and 4P5M.
Figure 4.
Figure 4.. Design and performance of machine learning models to predict HLA-II peptide ligands.
A. Overview of CAPTAn pipeline and architecture of binding core models (CAPTAn-core). The key functions in modeling epitope binding are convolutional layers (seeking contiguous amino acid patterns), local and global pooling (selecting strongest activations anywhere in the sequence). Letters or asterisks denote fixed or variable output dimensions, respectively. See also Data S1. B-C. Area under ROC and precision-recall curve in cross-validation experiments, where alleles are stratified by dataset of origin. CAPTAn-core models achieve highest classification performance in HLA-II heterodimers profiled in this work and re-processed published data. D. Ligands from monoallelic immunopeptidomics samples are grouped by isotype and merged into contiguous ligand regions on the source proteins. E. Architecture of the CAPTAn-context models. Input is a protein sequence of any length. Plate notations represent groups of bidirectional LSTM and dense layers. F. CAPTAn ensemble model formulation. Predictions of CAPTAn-core and CAPTAn-context models are aggregated at each protein position using a per-allele optimized weighted sum (Methods). G. Epitope prioritization accuracy. The top 30, 100, 300, 1000 non-overlapping peptides (20 aa) from 15,174 human proteins are ranked by each method and compared to observed data. Plus sign represents median accuracy. See also Figures S3 and S4, Tables S2 and S3 and Data S1.
Figure 5.
Figure 5.. Context models are associated with structural and physico-chemical properties of antigen source protein amino acid sequence.
A. Comparison of structural features in peptide ligands and decoys (ratio 1:5, n=1,307,023). Features predicted from amino acid sequences include hydrophobicity, membrane topology (TMHMM), PFAM domains (HMMER3), signal peptides (Interproscan), relative solvent accessibility and disorder (Netsurfp). B. Enrichment analysis of structural feature types. Bars show the difference in fraction of amino acids associated with each feature in ligands versus decoys (Wilcoxon test, ***P ≤ 0.001, **P ≤ 0.01). C. Fraction of amino acids associated with structural features for peptides prioritized by NetMHCIIpan and CAPTAn-context, compared to background rates. Predicted peptides are binned in confidence percentiles for each method. Dashed lines represent minimum and maximum across five data splits. Spearman correlation coefficients between predictions and structural features are shown. D-E. Classification performance for context models with or without memory (LSTM) or structural features, measured as area under ROC or precision-recall curves on validation data. While the models based only on short, 10–15 mer, sequences (CNN only) benefit from structural features, the latter add less to performance of memory-based models. (Wilcoxon test: *P ≤ 0.05, **P ≤ 0.01, ***P ≤ 0.001, ****P ≤ 0.0001).
Figure 6:
Figure 6:. The ensemble CAPTAn models accurately predict microbial epitopes presented by human DCs identified by immunopeptidomics.
A. A consortium of commensal bacteria from the microbiome (n=6 species) was cultured with monocyte-derived dendritic cells (DCs), and HLA-II immunopeptidomics was performed. Recovered peptides are shown per bacteria species. Black bars represent peptides that were also detected in proteomes of DCs post-bacterial feeding. Peptides are reported with either a 1% FDR or 1% FDR + additional quality filtering using spectral quality (Figure S5). B. Peptides were deconvoluted based on HLA-type of DC donor. Motif of filtered bacterial peptides using Gibbs Cluster 2.0 and most similar primary motifs for HLA-II-alleles. A majority of peptides conformed to the HLA-DRB1*03:01 motif. C. CAPTAn accurately predicts HLA-II peptide ligands derived from commensal microbes. Numbers report correctly ligands within top 3, 10, 30, and 100 predicted non-overlapping peptides. Numbers in parentheses show the total number of deconvoluted peptides with confidence score >50% for a given allele. D. Healthy human subjects generate T cell responses to microbiome epitopes. Cytokine responses were measured in PBMCs after stimulation in vitro with synthetic peptides. Eight peptides (DC1–8) were selected from CAPTAn predictions and peptidomics. Negative controls: DMSO, CLIP, IGRP. Positive controls: Infl_NP, C_tet. E. Donor-specific cytokine concentrations (pg/mL) in PBMCs, in response to stimulation with a panel of negative controls (DMSO, CLIP, and the self peptide IGRP) and candidate peptide epitopes DC7 and DC2. The significance is estimated with a one-sided Student T-test. F. Source of DC2 and DC7 peptides, including the number of genes encoding them in the gut microbiome and their expression based on metatranscriptomic profiling in HMP2. G. Peptide DC7 from V. parvula WP_156697519.1 was used to generate HLA-DRB1*03:01 tetramers. Tetramer staining and enrichment with magnetic beads was performed on healthy donor PBMCs prior to analysis by FACS and gating on CD45+CD3+ T cells (see Fig. S5 for gating strategy). See also Figure S5 and Tables S4 and S5.
Figure 7.
Figure 7.. Ensemble CAPTAn models recapitulate published SARS-CoV-2 epitopes and uncover novel DQ6 epitopes in the viral nucleoprotein antigen.
A. Comparison of CAPTAn-context predictions of SARS-CoV-2 nucleoprotein epitopes versus observed CD4+ T cell responses from 25 human studies. Predictions from the three isotype-specific context models (colored lines) are compared with lower bound CD4+ T cell response frequency of viral nucleoprotein ligand regions (black line). The response frequency estimate depended on the fraction and number of responders across published studies (proportion test, see Grifoni et al.). Gray rectangle corresponds to predicted DQA1*03:01,DQB1:06:03 epitope at N135–149. B. Pearson correlation coefficients between isotype-specific context model predictions and lower bound CD4+ T cell response frequencies (%) for all ORFs in SARS-Cov-2 proteome when aligned as in panel A. Coefficients for nucleoprotein are highlighted using colors consistent with panel A, while coefficients for other ORFs are shown in black. C. CAPTAn predictions for SARS-CoV-2 nucleoprotein (N) restricted to DQA1*03:01,DQB1:06:03. Red line shows predicted confidence of epitopes mapped to the amino acid sequence of N. Gray lines show predictions for six other human coronavirus strains (CVHN1, CVHN2, CVHN5, CVHOC, CVH22, CVHNL). Four epitopes with highest scores are printed in red (SARS2) and the corresponding region in another coronavirus strain is shown below. The strongest epitope candidate at residue N135 was TEGALNTPKDHIGTR. Arrow highlights an aspartate residue (D) present uniquely in SARS-CoV-2 nucleoprotein that determines P6 of the DQA1*03:01,DQB1:06:03 binding motif. Two bottom panels show multiple sequence alignment and homology (number of strains agreeing in an amino acid position). D. Multiple sequence alignment between N protein regions containing N135–150 of SARS-Cov-2 variants of concern. E. Number of mutations relative to the reference SARS-CoV-2 strain. Retrieved from https://covid-19.uniprot.org/ on Jan 31, 2022. F. Validation of T cell reactivity to N135 – DQA1*01:03-DQB1*06:03. Nine TCRs were selected from a convalescent COVID-19 patient based on their provenance from T cells with high cytokine secretion upon restimulation in vitro with pooled N peptides. TCRs were screened against N135 and N73 presented by DQA1*01:03-DQB1*06:03. BW5147.3 cells expressing HLA-DQ fused to peptide N135 at the N-terminus and CD3zeta on the C-terminus were co-cultured overnight with Expi293F cells expressing TCR and CD3. Surface HLA-DQ and 4–1BB expression on BW5147.3 cells were analyzed by flow-cytometry. 4–1BB expression is a surrogate activation marker indicating that TCR clone 21 reacts specifically with nucleoprotein peptide N135 presented by HLA-DQA1*01:03-DQB1*06:03. G. N135 peptide-presenting HLA-DQ tetramer staining of TCR clones expressed in Expi293F cells. See also Table S6.

References

    1. Borst J, Ahrends T, Bąbała N, Melief CJM, and Kastenmüller W. (2018). CD4+ T cell help in cancer immunology and immunotherapy. Nat. Rev. Immunol 18, 635–647. - PubMed
    1. Alfei F, Ho P-C, and Lo W-L (2021). DCision-making in tumors governs T cell anti-tumor immunity. Oncogene 40, 5253–5261. - PMC - PubMed
    1. Jurewicz MM, and Stern LJ (2019). Class II MHC antigen processing in immune tolerance and inflammation. Immunogenetics 71, 171–187. - PMC - PubMed
    1. Zheng MZM, and Wakim LM (2021). Tissue resident memory T cells in the respiratory tract. Mucosal Immunol. 10.1038/s41385-021-00461-z. - DOI - PMC - PubMed
    1. Germain RN, and Margulies DH (1993). The biochemistry and cell biology of antigen processing and presentation. Annu. Rev. Immunol 11, 403–450. - PubMed

Publication types