. 2023 Jun 10;14(1):3445.
doi: 10.1038/s41467-023-39120-1.

Discovery of senolytics using machine learning

Affiliations

Discovery of senolytics using machine learning

Vanessa Smer-Barreto et al. Nat Commun. .

Abstract

Cellular senescence is a stress response involved in ageing and diverse disease processes including cancer, type-2 diabetes, osteoarthritis and viral infection. Despite growing interest in targeted elimination of senescent cells, only few senolytics are known due to the lack of well-characterised molecular targets. Here, we report the discovery of three senolytics using cost-effective machine learning algorithms trained solely on published data. We computationally screened various chemical libraries and validated the senolytic action of ginkgetin, periplocin and oleandrin in human cell lines under various modalities of senescence. The compounds have potency comparable to known senolytics, and we show that oleandrin has improved potency over its target as compared to best-in-class alternatives. Our approach led to several hundred-fold reduction in drug screening costs and demonstrates that artificial intelligence can take maximum advantage of small and heterogeneous drug screening data, paving the way for new open science approaches to early-stage drug discovery.


Conflict of interest statement

The authors declare no competing interests.

Figures

Fig. 1
Fig. 1. Compounds employed to train machine learning models of senolytic action.
a We assembled training data from multiple sources. We mined 58 known senolytics (positives) from academic papers and a commercial patent, and integrated them with diverse compounds from the LOPAC-1280 and Prestwick FDA-approved-1280 chemical libraries (negatives). Chemical structures were featurised with 200 physicochemical descriptors computed with RDKit and binary labelled according to their senolytic action. These labelled data were employed to train binary classifiers predictive of senolytic activity. b Sources of the 58 senolytics employed for training, including the number of compounds per source and the cell lines where senolysis was identified. c Cluster structure of the senolytics employed for training using the RDKit descriptors as features. Plot shows the k-means clustering score and silhouette coefficient averaged across compounds for an increasing number of clusters (k). Error bars denote one standard deviation over 100 repeats with different initial seeds. The lack of a clear “elbow” in the k-means score and low silhouette coefficients suggest poor clustering among the senolytics employed for training. d Tanimoto distance graph of senolytics employed for training; nodes are compounds and edges represent compounds that are sufficiently close in the physicochemical feature space. Node colour indicates the data source as in panel b. To emphasise the overall dissimilarity between compounds, we set the edge thickness as the Tanimoto similarity (1-distance). Inset shows the distribution of Tanimoto distances across the 269 graph edges (median distance of 0.77). e Clustering of the Tanimoto distance graph using the Louvain algorithm for community detection. Plot shows the average number of clusters with respect to the resolution parameter (γ) across 100 runs (error bars denote one standard deviation); increasing values of γ produce a larger number of clusters. We observe pronounced plateaus at 5 and 6 clusters, suggesting some degree of clustering in the data. We computed the adjusted Rand index (ARI) averaged across all compounds to quantify the similarity between cluster labels and compound source labels (15 labels; panel e). Low ARI values indicate that Louvain clusters are substantially different from the literature source labels.
Fig. 2
Fig. 2. Training of machine learning models and computational screening.
a Pipeline for model training, compound screening, and hit validation. Several classification scores were used as performance metrics to determine the most suitable model for the computational screen. b Results from three machine learning models trained on 2523 compounds (Fig. 1a) and a reduced set of 165 features (Supplementary Fig. 1a); bar plots show average performance metrics computed in 5-fold cross-validation, with error bars denoting one standard deviation across folds. Mean ± s.d. are shown from n = 5 data folds. c The confusion matrices were computed from models trained on 70% of compounds, and tested on 17 positives and 740 negatives that were held-out from training. All models displayed poor performance metrics (Supplementary Table 1), and we chose the XGBoost algorithm for screening because of its lower number of false positives. d Results from computational screen of the L2100 TargetMol Anticancer and L3800 Selleck FDA-approved & Passed Phase chemical libraries, totalling 4340 compounds. The XGBoost model is highly selective and scored most compounds with a low probability of having senolytic action; a small fraction of N = 21 compounds were scored with P > 44%, which we selected for experimental validation. e Compounds selected for screening, ranked according to their z-score normalised prediction scores from the XGBoost model; the selected compounds are far outliers in the distribution of panel c. f Two-dimensional t-SNE visualisation of all compounds employed in this work; t-SNE plots were generated with perplexity 50, learning rate 200, and maximal number of iterations 1200. Compounds with prediction scores above 44% from the XGBoost model are marked with orange circles.
Fig. 3
Fig. 3. Experimental characterisation of compounds selected for screening in oncogene-induced senescent (OIS) cells.
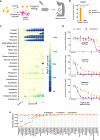
a Experimental setup of OIS model with IMR90 ER:RAS cells. Senescence was induced by addition of 4-OHT at 100 nM during the duration of the experiment (8 days). Control and senescent cells were plated in a 384-well plate on day five of 4-OHT induction. Top predicted compounds were added after multiwell seeding, and 72 h afterwards, the cells were fixed, and the nuclei stained and counted. b Bar plot of OIS positive experimental control, ouabain, at 46.4 nM. Data is normalised to DMSO. Data represented as individual points, and bars and error bars represent the mean ± SEM of three independent experiments. Statistical analysis was performed using a two-sided two-sample t-test for difference in mean value: ***p < 0.001; p = 2.6 × 10−4. c Results from experimental validation of controls and the top 21 compounds from Fig. 2d predicted to have senolytic action with P > 44%. Three compounds out of the 21 displayed senolytic activity: ginkgetin, oleandrin and periplocin; heatmap shows mean across n = 3 replicates. This drug screen was done once with three experimental replicates. d Dose-response curves of the three newly found senolytic compounds. The senolytic index (SI) is defined as the ratio between the IC50 of control cells and the IC50 of senescent cells. Data is normalised to DMSO. Mean ± s.d. are shown from n = 3 experiments. Oleandrin and periplocin are related steroid saponins, similar to ouabain. Ginkgetin is a structurally distinct biflavone; the structures of the three compounds can be found in Supplementary Fig. 11. e Tanimoto distance between the three validated senolytics and those employed for model training; distances were calculated using the RDKit descriptors that were employed in the training of machine learning models in Fig. 2b and Supplementary Table 2. Source data are provided as a Source Data file.
Fig. 4
Fig. 4. Senolytic performance of oleandrin and periplocin.
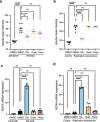
a Cell survival assay measuring the senolytic effect in OIS. The panels show a representative crystal violet staining of tissue culture dishes of confluent senescent IMR90 ER:RAS and control IMR90 ER:STOP cells cultured with 100 nM 4OHT, and treated with 10 nM oleandrin, ouabain and periplocin, and DMSO as vehicle control for 72 h. b Cell survival by quantification of the crystal violet staining of the experiment shown in a, as described in “Methods” section. Data represented as individual data points, and bars and error bars representing the mean ± SEM of 12 independent experiments. Statistical analysis was performed using a one-way ANOVA (Tukey’s test) for multiple comparisons. c Cell survival assay measuring the senolytic effect in replicative senescence. Graphs representing the cell survival by quantification of the crystal violet staining of confluent cultures of IMR90 cells at passage 27 (replicative senescence) and IMR90 cells at passage 13 (control) treated with 10 nM oleandrin, ouabain and periplocin, and DMSO as vehicle control for 72 h (related to Supplementary Fig. 9b). Data represented as individual data points, and bars and error bars representing the mean ± SEM of 12 independent experiments. Statistical analysis was performed using a one-way ANOVA (Tukey’s test) for multiple comparisons. d Caspase 3/7 activity assay in control IMR90 ER:STOP and senescent IMR90 ER:RAS cells cultured in media containing 100 nM 4OHT, and treated during 35 h with 10 nM oleandrin, ouabain and periplocin, and DMSO as vehicle control. The panels show representative fluorescent images of caspase 3/7 positive cells (lower panels) and brightfield images (upper panels) of the same field for cell scoring. Percentage of green fluorescent cells per condition is indicated in the panel figures. Representative data of one of two independent experiments. Scale bars represent 100 μm. ns not significant, *p < 0.05, **p < 0.01, ***p < 0.001, ****p < 0.0001. Source data are provided as a Source Data file.
Fig. 5
Fig. 5. Activity of oleandrin and periplocin on their senolytic targets.
a, b Intracellular K+ levels measured using Asante staining in a 100 nM 4OHT containing cultures of senescent IMR90 ER:RAS cells treated with 10 nM oleandrin, ouabain and periplocin, or DMSO as vehicle control, compared with IMR90 ER:STOP controls (n = 7), and b in IMR90 cells at passage 27 (replicative senescence) treated with 10 nM oleandrin, ouabain and periplocin, or DMSO as control vehicle compared to IMR90 cells at passage 13 (control) (n = 6). Data represented as individual data points and the mean ± SEM. Statistical analysis was performed using a one-way ANOVA (Tukey’s test) for multiple comparisons. Representative images of Asante cell staining are shown in Supplementary Fig. 9h, i. c, d mRNA expression of NOXA determined by RT-qPCR in c 100 nM 4OHT containing cultures of senescent IMR90 ER:RAS cells treated with 10 nM oleandrin, ouabain and periplocin, and DMSO as control, compared to control IMR90 ER:STOP cells (n = 4), and d IMR90 cells at passage 27 (replicative senescence) treated with 10 nM oleandrin, ouabain and periplocin, and DMSO control compared to IMR90 proliferating cells at passage 13 (control) (n = 3). Data represented as individual data points and the mean ± SEM. Statistical analysis was performed using a one-way ANOVA (Dunnett’s test) for multiple comparisons. ns not significant, *p < 0.05, **p < 0.01, ***p < 0.001, ****p < 0.0001. Source data are provided as a Source Data file.

References

    1. Gorgoulis V, et al. Cellular senescence: defining a path forward. Cell. 2019;179:813–827. doi: 10.1016/j.cell.2019.10.005. - DOI - PubMed
    1. Herranz, N. & Gil, J. Mechanisms and functions of cellular senescence. J. Clin. Investig.10.1172/jci95148 (2018). - PMC - PubMed
    1. Coppé J-P, Desprez P-Y, Krtolica A, Campisi J. The senescence-associated secretory phenotype: the dark side of tumor suppression. Annu. Rev. Pathol. 2010;5:99–118. doi: 10.1146/annurev-pathol-121808-102144. - DOI - PMC - PubMed
    1. Muñoz-Espín, D. et al. Programmed cell senescence during mammalian embryonic development. Cell10.1016/j.cell.2013.10.019 (2013). - PubMed
    1. Storer M, et al. Senescence is a developmental mechanism that contributes to embryonic growth and patterning. Cell. 2013;155:1119–1130. doi: 10.1016/j.cell.2013.10.041. - DOI - PubMed

Publication types

Substances