. 2023 Jun 10;14(1):3431.
doi: 10.1038/s41467-023-39129-6.

Scarless wound healing programmed by core-shell microneedles

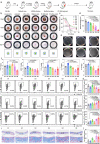
Affiliations

Scarless wound healing programmed by core-shell microneedles

Ying Zhang et al. Nat Commun. .

Abstract

Effective reprogramming of chronic wound healing remains challenging due to the limited drug delivery efficacy hindered by physiological barriers, as well as the inappropriate dosing timing in distinct healing stages. Herein, a core-shell structured microneedle array patch with programmed functions (PF-MNs) is designed to dynamically modulate the wound immune microenvironment according to the varied healing phases. Specifically, PF-MNs combat multidrug-resistant bacterial biofilm at the early stage via generating reactive oxygen species (ROS) under laser irradiation. Subsequently, the ROS-sensitive MN shell gradually degrades to expose the MN core component, which neutralizes various inflammatory factors and promotes the phase transition from inflammation to proliferation. In addition, the released verteporfin inhibits scar formation by blocking Engrailed-1 (En1) activation in fibroblasts. Our experiments demonstrate that PF-MNs promote scarless wound repair in mouse models of both acute and chronic wounds, and inhibit the formation of hypertrophic scar in rabbit ear models.


Conflict of interest statement

Z.G., Y.Z., S.W., and Ying Z. have applied for a patent related to this work. Z.G. is the co-founder of Zenomics Inc., Zencapsule Inc., Wskin Inc., and ZCapsule Inc.. Z.G. and Y.Z. are the co-founders of μZen Pharma Co., Ltd., and the other authors declare no conflict of interest.

Figures

Fig. 1
Fig. 1. Schematic of scarless wound healing process programmed by core-shell structured PF-MNs.
Schematic illustration of a the structure of PF-MNs and b the programmed regulation process for chronic wound, including elimination of bacterial biofilm via generating ROS, release of VP for scarless wound regeneration, and cytokine neutralization as well as macrophage transformation by cHP core. PVA poly (vinyl alcohol), cHP crosslinked heparin, VP verteporfin, ROS reactive oxygen species, TSPBA a ROS-responsive crosslinker, En1 Engrailed-1, YAP Yes-associated protein.
Fig. 2
Fig. 2. The fabrication process and characterizations of PF-MNs with core-shell structure.
a Schematic of the fabrication process of PF-MN arrayed patch via mold casting. b Representative photograph of the PF-MN patch. Scale bar, 1 mm. c The SEM images showing the (i) Side and (ii) Bottom view of the shell of PF-MN patch. Scale bar, 500 μm. (iii) The enlarged SEM image displaying one PF-MN. Scale bar, 100 μm. d Representative confocal images of Rhodamine B labeled PF-MN shell from a bottom view. The intervals at z-direction were set as 100 μm. Scale bar, 200 μm. e Representative images of the core-shell structured PF-MN. DiI-labeled PVA shell (red) and FITC-labeled heparin core (green). Scale bar, 100 μm. f Mechanical strength of MN shell and PF-MN. g ROS generation from PF-MNs loaded with VP (3 μg) under 690 nm laser irradiation (25 mW/cm2) (n = 3 independent samples). h Accumulated release of VP from PF-MN shell in PBS with different concentrations of H2O2 (n = 3 independent samples). i Protein levels of YAP and α-SMA in fibroblasts treated with different concentrations of VP as determined by Western blot. j Binding kinetics of IFN-γ by differently charged MNs (n = 4 independent samples). k Flow cytometry analysis indicating the transformation of macrophages towards M1 phenotype induced by IFN-γ could be inhibited by PF-MNs (n = 3 independent samples). Three independent experiments were performed and representative results are shown in ce. Data are presented as mean ± SD and statistical significance was analyzed via one-way ANOVA with Tukey’s multiple comparison test. P value: ****P < 0.0001.
Fig. 3
Fig. 3. Evaluation of antibacterial and anti-biofilm activities by PF-MNs.
a Photographs of bacterial colonies of SAE. coli, and MRSA on LB agar plates after different treatments. b Corresponding bacterial viability of SAE. coli, and MRSA after different treatments (n = 3 independent samples). c Photographs of the immature biofilms stained by crystal violet, showing the inhibitory effects of PF-MNs. d Confocal images and corresponding 3D images of DMAO-stained (green) immature biofilms after different treatments. Scale bar, 200 μm. e The SEM images of immature biofilms with different treatments after the gradient dehydration. Scale bar, 3 μm. f, g Corresponding OD 570 value (f) and inhibition rate (g) of immature biofilms of each group (n = 3 independent samples). h Corresponding fluorescence intensities of DMAO-stained immature biofilms (n = 4 independent samples). i Photographs of the mature biofilms stained by crystal violet, showing the destructive effects of PF-MNs. j Confocal images and corresponding 3D images of DMAO-stained (green) mature biofilms after different treatments. Scale bar, 200 μm. k The representative SEM images with different treatments after the gradient dehydration of mature biofilms. Scale bar, 3 μm. lm Corresponding OD 570 value (l) and destruction rate (m) of mature biofilms (n = 3 independent samples). n Corresponding fluorescence intensities of DMAO-stained mature biofilms (n = 4 independent samples). L Laser. Three independent experiments were performed and representative results are shown in ce, ik. Data are presented as mean ± SD and statistical significance was analyzed via one-way ANOVA with Tukey’s multiple comparison test. P value: *P < 0.05, **P < 0.01, ***P < 0.001, ****P < 0.0001.
Fig. 4
Fig. 4. In vivo wound healing efficacy on diabetic mice infected by MRSA.
a Experimental illustration presenting PF-MN-mediated wound healing on diabetic mice infected with MRSA. b Photographs of wounds of BALB/c mice at different time points after varied treatments. Scale bar, 2 mm. c Quantitative analysis of the relative wound areas at different times (n = 6 biologically independent samples). d, e Bacterial viability (d) and corresponding photographs (e) of bacterial colonies of MRSA on LB agar plates in the wounds on day 3 post-treatments (n = 3 biologically independent samples). f Quantitative analysis of the levels of IFN-γ, MCP-1, TNF-α, IL-1β, and IL-6 from the wounds on day 3 post-treatments (n = 3 biologically independent samples). g, h Representative flow cytometry plots (g) of macrophage and regulatory T cell analyzed from wounds on day 3 and corresponding quantitative results (h) (n = 5 biologically independent samples). i, j Representative Masson Trichrome staining images (i) of wounds on day 14 and quantitative analysis of hair follicles (j). Scale bar, 1 mm (top) and 200 μm (enlarged) (n = 3 biologically independent samples). Three independent experiments were performed and representative results are shown in i. Data are presented as mean ± SD and statistical significance was analyzed via one-way ANOVA with Tukey’s multiple comparison test. P value: *P < 0.05, **P < 0.01, ***P < 0.001, **** =P < 0.0001.
Fig. 5
Fig. 5. Inhibition of scar formation and alleviation of HS by PF-MNs on rabbit ears.
a Experimental schematic of PF-MN assisted scarless wound healing on rabbit ears. b Photographs of wounds on rabbit ears with varied treatments at different time points. Scale bar, 5 mm. c Representative H&E staining, Masson Trichrome staining, and Sirius Red staining images of wounds on day 30. Scale bar, 1 mm in H&E staining images (top), 200 μm in H&E staining images (enlarged), Masson Trichrome staining, and Sirius Red staining images. df Quantitative analysis of SEI (d), percentage of collagen (e), and type I/III collagen ratio (f) of wounds (n = 3 biologically independent samples). g Experimental schematic of PF-MNs for PDT of HS. h Photographs of scars on rabbit ears after varied treatments at different times. Scale bar, 5 mm. i Representative H&E staining, Masson Trichrome staining, and Sirius Red staining images of HS on day 15. Scale bar, 1 mm in H&E staining images (top), 200 μm in H&E staining images (enlarged), Masson Trichrome staining, and Sirius Red staining images. jl Quantitative analysis of SEI (j), percentage of collagen (k), and type I/III collagen ratio (l) of HS (n = 3 biologically independent samples). bPF-MN: blank PF-MN. Three independent experiments were performed and representative results are shown in c and i. Data are presented as mean ± SD and statistical significance was analyzed via one-way ANOVA with Tukey’s multiple comparison test. P value: *P < 0.05, **P < 0.01, ***P < 0.001, ****P < 0.0001.

References

    1. Mu R, Campos de Souza S, Liao Z, Dong L, Wang C. Reprograming the immune niche for skin tissue regeneration - from cellular mechanisms to biomaterials applications. Adv. Drug Deliv. Rev. 2022;185:114298. doi: 10.1016/j.addr.2022.114298. - DOI - PubMed
    1. Bryan K, Sun ZS, Paul A. Advances in skin grafting and treatment of cutaneous wounds. Science. 2014;346:941–945. doi: 10.1126/science.1253836. - DOI - PubMed
    1. Opdenakker G, Van Damme J, Vranckx JJ. Immunomodulation as rescue for chronic atonic skin wounds. Trends Immunol. 2018;39:341–354. doi: 10.1016/j.it.2018.01.010. - DOI - PubMed
    1. Greenlee-Wacker MC. Clearance of apoptotic neutrophils and resolution of inflammation. Immunol. Rev. 2016;273:357–370. doi: 10.1111/imr.12453. - DOI - PMC - PubMed
    1. Kharaziha M, Baidya A, Annabi N. Rational design of immunomodulatory hydrogels for chronic wound healing. Adv. Mater. 2021;33:e2100176. doi: 10.1002/adma.202100176. - DOI - PMC - PubMed

Publication types

Substances