. 2023 Jun 10;14(1):3429.
doi: 10.1038/s41467-023-39185-y.

Impaired histone inheritance promotes tumor progression

Affiliations

Impaired histone inheritance promotes tumor progression

Congcong Tian et al. Nat Commun. .

Abstract

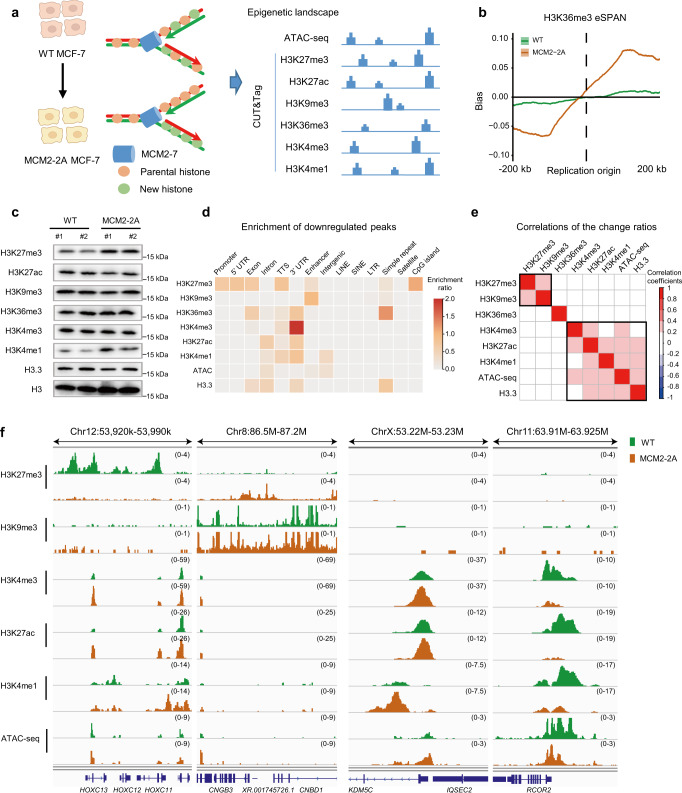
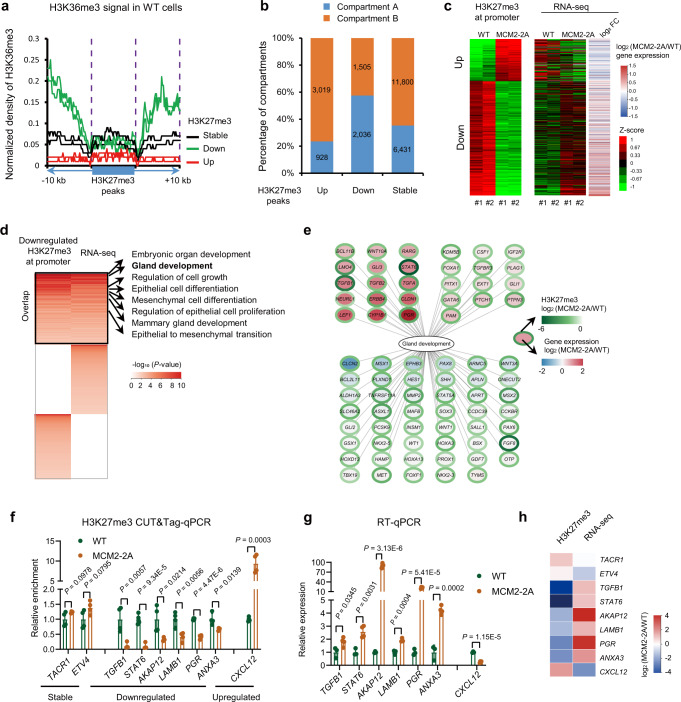
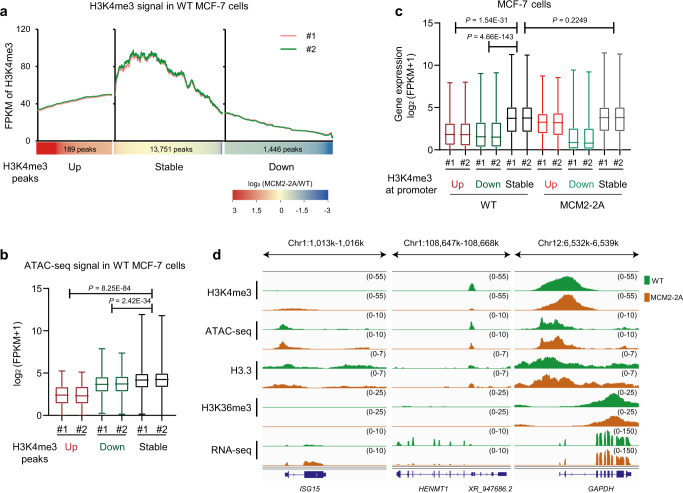
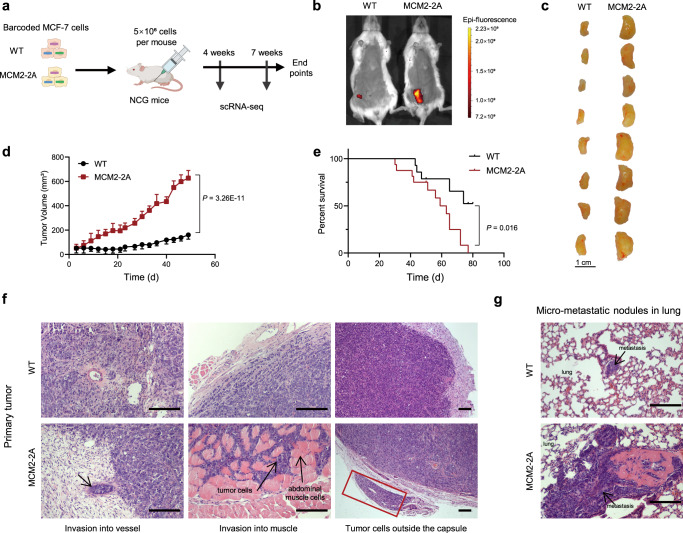
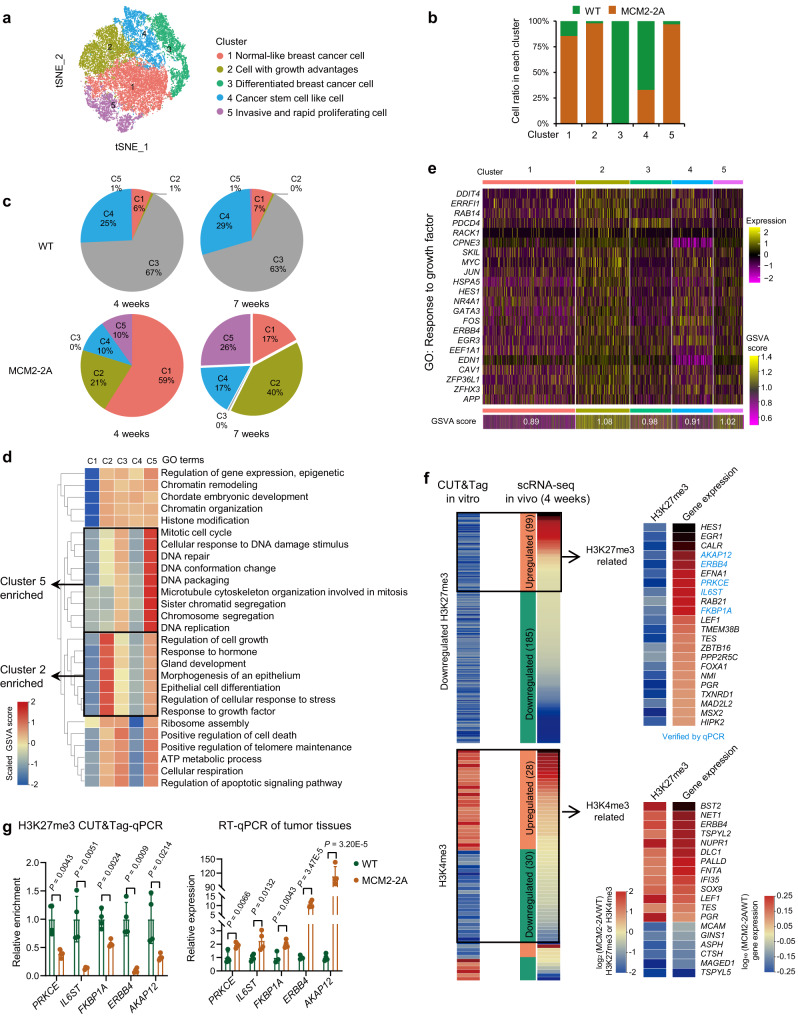
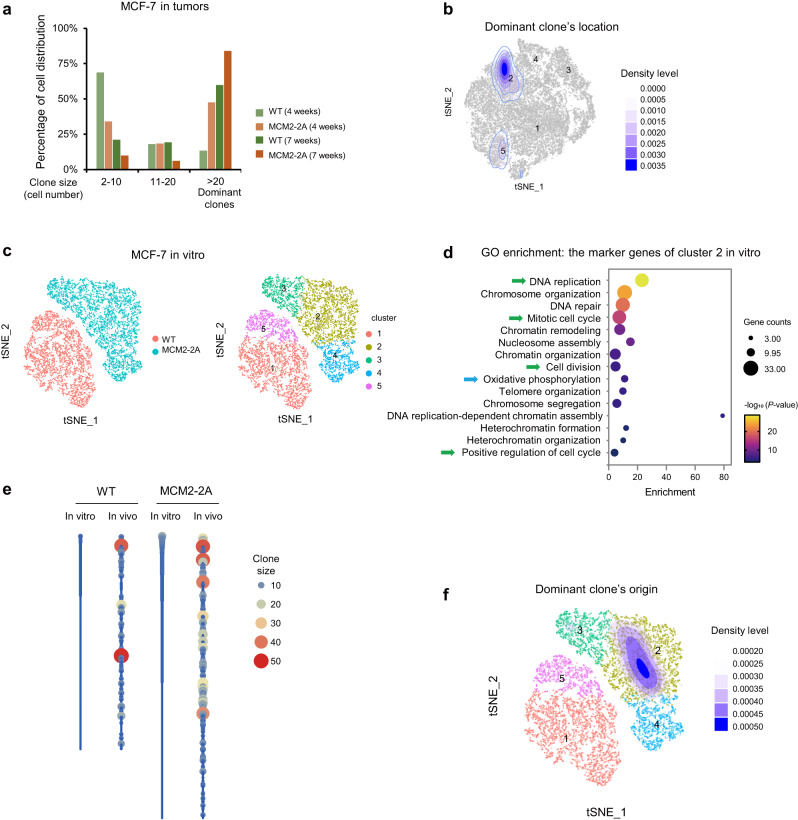
Faithful inheritance of parental histones is essential to maintain epigenetic information and cellular identity during cell division. Parental histones are evenly deposited onto the replicating DNA of sister chromatids in a process dependent on the MCM2 subunit of DNA helicase. However, the impact of aberrant parental histone partition on human disease such as cancer is largely unknown. In this study, we construct a model of impaired histone inheritance by introducing MCM2-2A mutation (defective in parental histone binding) in MCF-7 breast cancer cells. The resulting impaired histone inheritance reprograms the histone modification landscapes of progeny cells, especially the repressive histone mark H3K27me3. Lower H3K27me3 levels derepress the expression of genes associated with development, cell proliferation, and epithelial to mesenchymal transition. These epigenetic changes confer fitness advantages to some newly emerged subclones and consequently promote tumor growth and metastasis after orthotopic implantation. In summary, our results indicate that impaired inheritance of parental histones can drive tumor progression.


Conflict of interest statement

The authors declare no competing interests.

Figures

Fig. 1
Fig. 1. Impaired histone inheritance results in genome-wide epigenetic reprogramming in MCM2-2A mutant MCF-7 breast cancer cells.
a Experimental design: Epigenetic landscapes of chromatin accessibility and histone modifications were characterized using ATAC-seq and CUT&Tag in WT and MCM2-2A mutant MCF-7 cells. Created with BioRender.com. b Average bias of H3K36me3 in MCM2-2A mutant and WT MCF-7 cells, as determined using eSPAN. The exacerbated leading bias in MCM2-2A mutant cells means parental histone H3K36me3 recycled to the leading strand is more than that recycled to the lagging strand. c Western blot analysis of select histone marks and histone variant H3.3 using total cell lysates from MCM2-2A mutant and WT MCF-7 cells. Total histone H3 was used as a loading control. #1 and #2 indicate two independent clones in each group. This experiment was repeated 3 times independently with similar results. d Integration analysis showing which types of genomic regions are enriched for downregulated histone marks, histone variant H3.3 or chromatin accessibility (ATAC-seq) in MCM2-2A mutant MCF-7 cells. The color filled in each cell represents the enrichment ratio of the downregulated peaks superior to the stable peaks. The detailed calculation process for enrichment ratio is depicted in Methods. e Correlations of the change ratios between each pair of histone marks, histone variant H3.3 and chromatin accessibility. Briefly, the genome was divided into bins (10 kb each). FPKM signals were scanned and the intensity ratio (MCM2-2A mutant vs. WT FPKM intensity) was calculated for each bin, and then Pearson correlation coefficients for the intensity ratios were calculated for each pair. Correlation is displayed when P < 0.01. f Integrative Genomics Viewer tracks showing the distribution and correlation of histone modifications at indicated loci in MCM2-2A mutant and WT MCF-7 cells. In MCM2-2A mutant cells, H3K27me3 was downregulated at development-related HOXC cluster, while H3K27me3 and H3K9me3 were upregulated at intergenic regions between CNGB3 and CNBD1 (left two panels). The up- and downregulation of active histone marks (H3K4me3, H3K27ac), enhancer marker (H3K4me1), and chromatin accessibility (ATAC-seq) were consistent at KDM5C and RCOR2 loci, respectively (right two panels). eSPAN enrichment and sequencing of protein-associated nascent DNA, UTR untranslated region, TTS transcription termination sites, LINE long interspersed nuclear elements, SINE short interspersed nuclear elements, LTR long terminal repeat retrotransposons.
Fig. 2
Fig. 2. MCM2-2A mutation leads to H3K27me3 reprogramming and derepression of development-related genes in MCF-7 cells.
a Average signal of H3K36me3 in WT MCF-7 cells at peaks (±10 kb) at which H3K27me3 was upregulated, stable, or downregulated in MCM2-2A mutant vs. WT cells. In WT cells, levels of H3K36me3 in areas flanking H3K27me3 downregulated peaks were higher than that flanking H3K27me3 stable or upregulated peaks. Two independent clones were shown. b Proportion of H3K27me3 peaks belonging to A-type (open) vs. B-type (closed) compartments, stratified by whether the peaks were upregulated, stable, or downregulated in MCM2-2A mutant vs. WT MCF-7 cells. The A/B compartment profiles were obtained from the published normalized Hi-C matrix data of MCF-7 (GEO accession: GSE66733). c Heatmap showing signal intensity differences in H3K27me3 at promoters (left panel) and corresponding changes of gene expression (right panel) in MCM2-2A mutant vs. WT MCF-7 cells. d Heatmap showing P-values from a GO analysis of (1) genes with downregulated H3K27me3 at their promoters, as detected by CUT&Tag, and (2) differentially expressed genes between MCM2-2A mutant and WT cells, as detected using RNA-seq. GO terms of these gene sets overlapped well. One-sided hypergeometric test without adjustment was used to calculate statistical significance. e Fold change in expression levels (MCM2-2A mutant/WT) of genes associated with gland development at whose promoter H3K27me3 was downregulated in MCM2-2A mutant vs. WT MCF-7 cells. The color of each gene’s circular border represents the fold change in H3K27me3 levels at its promoter, whereas the color inside represents the fold change in gene expression. f CUT&Tag-qPCR for H3K27me3 occupancy at selected regions in MCM2-2A mutant and WT MCF-7 cells. Data are presented as mean values ± SD. n = 4 (2 experiments over 2 independent clones). Two-sided Student’s t test. g mRNA levels measured by RT-qPCR in MCM2-2A mutant and WT MCF-7 cells. Data are presented as mean values ± SD. WT, n = 3 independent clones, MCM2-2A, n = 4 (2 experiments over 2 independent clones). Two-sided Student’s t test. h Heatmap showing the fold change of H3K27me3 signal and RNA expression identified by CUT&Tag sequencing and RNA-seq, respectively. FC fold change, qPCR quantitative real-time PCR, RT reverse transcription.
Fig. 3
Fig. 3. Transcriptionally active chromatin state remains stable during the epigenetic reprogramming of MCM2-2A mutant MCF-7 cells.
a H3K4me3 signal in WT MCF-7 cells, at H3K4me3 peaks that were upregulated, stable, or downregulated in MCM2-2A mutant vs. WT cells. #1 and #2 indicate two independent WT MCF-7 clones. b Boxplots depicting chromatin accessibility (ATAC-seq signal) in WT MCF-7 cells at H3K4me3 peaks upregulated (n = 189), stable (n = 13,751), or downregulated (n = 1446) in MCM2-2A mutant vs. WT cells. Two-way repeated measures ANOVA adjusted by LSD for multiple comparisons indicates that the chromatin accessibility at H3K4me3 stable regions was significantly higher than that at H3K4me3 up- or downregulated regions. c Boxplots representing expression (RNA-seq data) of genes with H3K4me3 upregulated (n = 249), stable (n = 18,508), or downregulated (n = 1151) promoters in MCM2-2A mutant (right) and WT (left) MCF-7 cells. Two-way repeated measures ANOVA adjusted by LSD for multiple comparisons indicates that the expression of genes in WT cells with H3K4me3 stable promoters was significantly higher than that with H3K4me3 up- or downregulated promoters, in addition, the expression of genes with H3K4me3 stable promoters was similar between MCM2-2A mutant and WT cells. The box plots in b, c display the median, upper and lower quartiles; the whiskers show 1.5× interquartile range (IQR). d Integrative Genomics Viewer tracks showing distributions of histone modifications and histone variant H3.3 (CUT&Tag data), chromatin accessibility (ATAC-seq data), and gene expression (RNA-seq data) for selected loci in MCM2-2A mutant and WT MCF-7 cells. The chromatin state for GAPDH (right panel) was more active than ISG15 with upregulated H3K4me3 (left panel) and HENMT1 with downregulated H3K4me3 (middle panel) in WT cells and remained stable in MCM2-2A mutant cells. FPKM, Fragments Per Kilobase per Million mapped fragments.
Fig. 4
Fig. 4. Impaired parental histone inheritance facilitates tumor growth and metastasis in vivo.
a Experimental design: MCM2-2A mutant and WT MCF-7 cells with unique barcodes were expanded and transplanted into the fourth mammary fat pads of immunocompromised NOD/ShiLtJGpt-Prkdcem26Cd52Il2rgem26Cd22/Gpt (NCG) mice. Resulting tumors were subjected to scRNA-seq 4 and 7 weeks post-transplantation. Created with BioRender.com. b Representative IVIS eGFP fluorescence imaging of orthotopic MCM2-2A mutant and WT MCF-7 tumors at 7 weeks post-transplantation. c Representative images taken 7 weeks post-transplantation are shown for MCM2-2A mutant and WT MCF-7 tumors. d Average growth curves of tumors resulting from MCM2-2A mutant and WT MCF-7 cells. Error bars, SD (n = 10, each group); Two-sided Student’s t test. e Kaplan–Meier survival analysis of mice bearing MCM2-2A mutant and WT MCF-7 tumors (WT, n = 15; MCM2-2A, n = 16). P = 0.016, log-rank test. f HE staining showing the representative images of primary tumor tissue from MCM2-2A mutant and WT MCF-7 tumors. Scale bar, 200 μm. g HE staining showing the representative images of micro-metastatic nodules in the lung of mice bearing MCM2-2A mutant and WT MCF-7 tumors. Scale bar, 200 μm. The experiments in f, g were repeated in 8 mice independently with similar results.
Fig. 5
Fig. 5. Impaired histone inheritance in MCM2-2A mutant MCF-7 cells promotes tumor progression by forming distinct subclones in vivo.
a Visualization of scRNA-seq data showing that cells in MCM2-2A mutant and WT tumors fell into five distinct clusters. scRNA-seq data from tumors analyzed 4 and 7 weeks post-transplantation were projected onto a t-distributed stochastic neighbor embedding (t-SNE) plot. Five clusters were identified and characterized. b Proportion of MCM2-2A mutant and WT tumor cells in each of the five clusters. c Proportion of cells from each cluster in WT (upper two panels) and MCM2-2A mutant (lower two panels) tumors harvested at 4 weeks (left two panels) and 7 weeks (right two panels) post-transplantation. d Heatmap showing top enriched GO terms for each cluster. The color filled in each cell represents the average gene set variation analysis (GSVA) score for that term in that cluster. e Heatmap of expression for genes associated with the response to growth factor GO term in each cell from five clusters, with GSVA scores of this gene set shown at the bottom. Each column represents a single cell. f Heatmap showing the changes of H3K27me3 (upper panel) and H3K4me3 (lower panel) signal at promoters and the expression changes of their target genes post-transplantation. Growth-, proliferation- or metastasis-related genes with H3K27me3 downregulated or H3K4me3 dysregulated promoters were displayed. The fold change of RNA expression is calculated by comparing the average expression of each single cell in MCM2-2A mutant to WT tumor collected 4 weeks post-transplantation. g CUT&Tag-qPCR for H3K27me3 occupancy at the promoter regions of selected genes (blue) in f, and corresponding gene expression measured by RT-qPCR in MCM2-2A mutant and WT MCF-7 tumors. Data are presented as mean values ± SD. CUT&Tag-qPCR, n = 4 (2 experiments over 2 independent clones). RT-qPCR, n = 4 tumors from independent mice. Two-sided Student’s t test. GO Gene Ontology, qPCR quantitative real-time PCR, RT reverse transcription.
Fig. 6
Fig. 6. Histone inheritance disorder drives dominant clone formation in MCM2-2A mutant MCF-7 tumors.
a Percentage of cells distributed in clones containing 2–10, 11–20, or >20 cells in MCM2-2A mutant and WT tumors. Cells harvested from mouse tumors 4 or 7 weeks post-transplantation are shown, respectively. Cells with the same lineage barcode are defined as a “clone” from the same ancestor cell. b Contour plots showing cell density of a representative dominant clone projected onto t-SNE plot for MCM2-2A mutant cells. Cells in the dominant clone mainly distribute in cluster 2. c scRNA-seq of in vitro MCM2-2A mutant and WT MCF-7 cells. Cells were dissolved into 5 clusters. Clusters 2, 3 and 4 were mainly composed of MCM2-2A cells, and clusters 1 and 5 were composed of WT cells. d Gene ontology enrichment analysis for marker genes of cluster 2 in vitro. One-sided hypergeometric test without adjustment was used to calculate statistical significance. Green arrows represent cell proliferation and blue arrow represents metabolism reprogramming. e Barcode abundance (clone size) in the tumor cell population prior to engraftment (in vitro) and in tumors 4 weeks post-transplantation (in vivo). Barcodes are ordered vertically according to their initial abundance (highest to lowest from top to bottom) in vitro, only the barcodes that are simultaneously captured both in vitro and in vivo are shown. The number of clones that would grow into dominant clones from MCM2-2A MCF-7 cells is far more than that from WT cells. f Contour plots projected onto t-SNE plot showing cell density of in vitro MCM2-2A mutant cells that would grow into dominant clones. t-SNE t-distributed stochastic neighbor embedding.

Similar articles

Cited by

References

    1. Stewart-Morgan KR, Petryk N, Groth A. Chromatin replication and epigenetic cell memory. Nat. Cell Biol. 2020;22:361–371. doi: 10.1038/s41556-020-0487-y. - DOI - PubMed
    1. Escobar TM, Loyola A, Reinberg D. Parental nucleosome segregation and the inheritance of cellular identity. Nat. Rev. Genet. 2021;22:379–392. doi: 10.1038/s41576-020-00312-w. - DOI - PMC - PubMed
    1. Flavahan, W. A., Gaskell, E. & Bernstein, B. E. Epigenetic plasticity and the hallmarks of cancer. Science357, eaal2380 (2017). - PMC - PubMed
    1. Huang H, et al. A unique binding mode enables MCM2 to chaperone histones H3-H4 at replication forks. Nat. Struct. Mol. Biol. 2015;22:618–626. doi: 10.1038/nsmb.3055. - DOI - PMC - PubMed
    1. Gan H, et al. The Mcm2-Ctf4-Polalpha axis facilitates parental histone H3-H4 transfer to lagging strands. Mol. Cell. 2018;72:140.e3–151.e3. doi: 10.1016/j.molcel.2018.09.001. - DOI - PMC - PubMed

Publication types