. 2023 Jun 10;14(1):3440.
doi: 10.1038/s41467-023-39096-y.

Vaccine-induced protection against SARS-CoV-2 requires IFN-γ-driven cellular immune response

Affiliations

Vaccine-induced protection against SARS-CoV-2 requires IFN-γ-driven cellular immune response

Xiaolei Wang et al. Nat Commun. .

Abstract

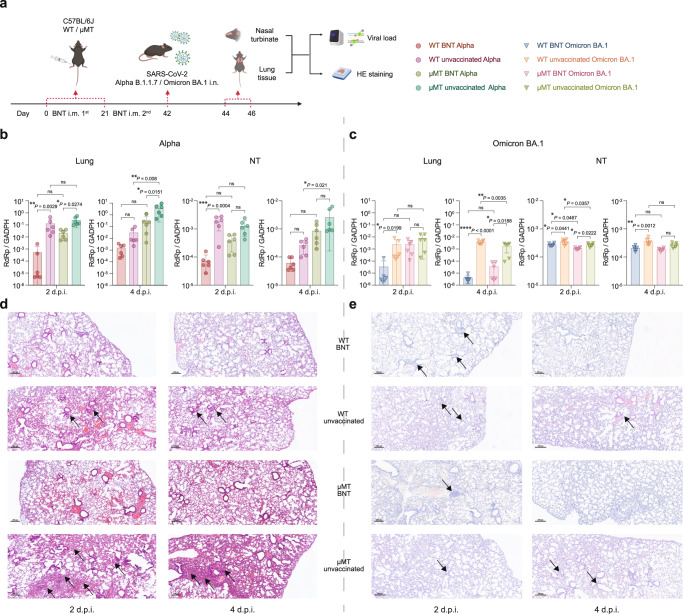
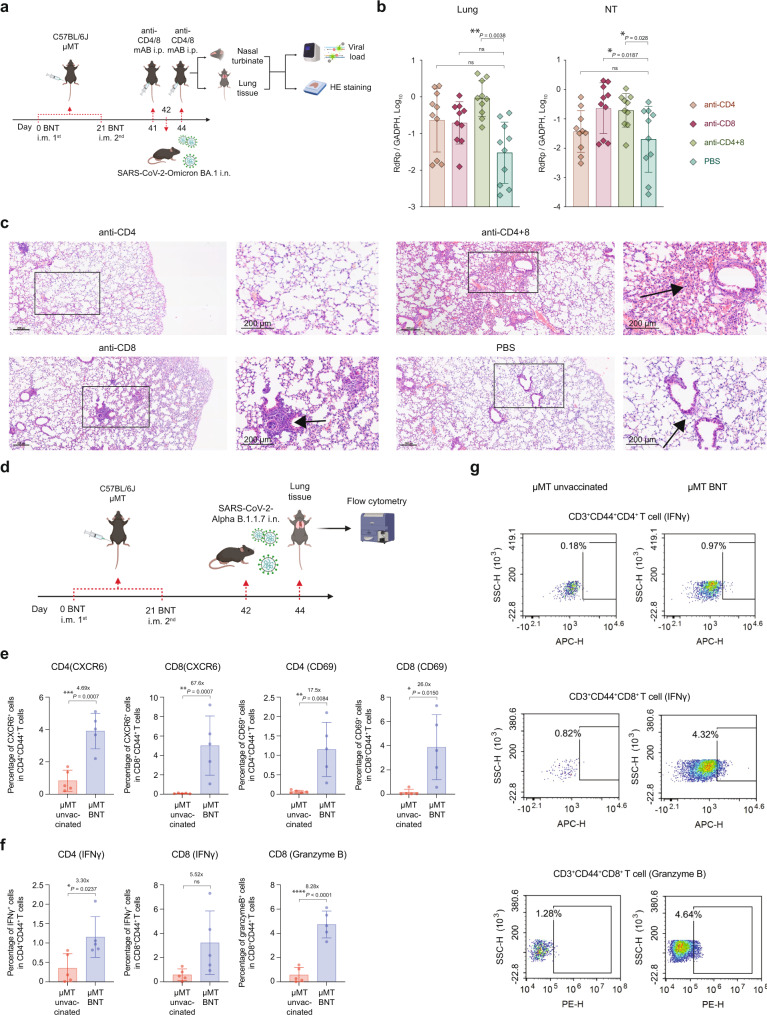
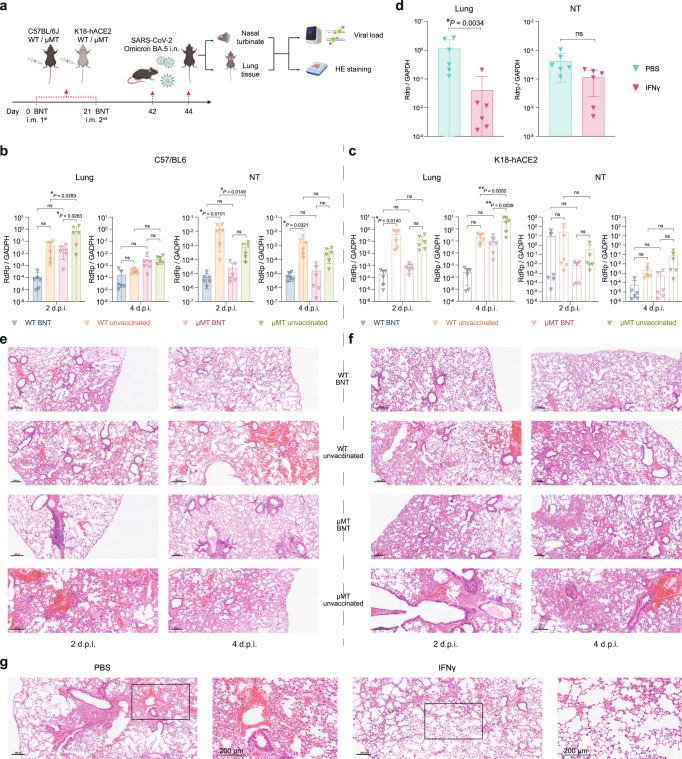
The overall success of worldwide mass vaccination in limiting the negative effect of the COVID-19 pandemics is inevitable, however, recent SARS-CoV-2 variants of concern, especially Omicron and its sub-lineages, efficiently evade humoral immunity mounted upon vaccination or previous infection. Thus, it is an important question whether these variants, or vaccines against them, induce anti-viral cellular immunity. Here we show that the mRNA vaccine BNT162b2 induces robust protective immunity in K18-hACE2 transgenic B-cell deficient (μMT) mice. We further demonstrate that the protection is attributed to cellular immunity depending on robust IFN-γ production. Viral challenge with SARS-CoV-2 Omicron BA.1 and BA.5.2 sub-variants induce boosted cellular responses in vaccinated μMT mice, which highlights the significance of cellular immunity against the ever-emerging SARS-CoV-2 variants evading antibody-mediated immunity. Our work, by providing evidence that BNT162b2 can induce significant protective immunity in mice that are unable to produce antibodies, thus highlights the importance of cellular immunity in the protection against SARS-CoV-2.


Conflict of interest statement

The authors declare no competing interests.

Figures

Fig. 1
Fig. 1. BNT162b2 induces robust cellular responses in mice C57BL/6 J μMT mice.
a Schematic diagram of the vaccination scheme, ELISA, and flow cytometry. b Antibodies titer specific for spike protein of SARS-CoV-2 was measured by ELISA (n = 5). cf The splenocytes were stimulated by spike proteins of SARS-CoV-2 Alpha or Omicron BA.1 variant and subjected to flow cytometry analysis for IFN-γ and IL-4 responses (n = 3). Data are presented as mean ± SD. Statistical significance was calculated using one-way ANOVA test (*p < 0.05, **p < 0.01, ***p < 0.001, ****p < 0.0001, ns = not significant). Figure 1a was created with BioRender.com.
Fig. 2
Fig. 2. BNT162b2 elicits significant protective immunity in C57BL/6 J μMT mice.
a Schematic diagram of vaccination, viral challenge, and pathological studies in C57BL/6 J model. b, c The viral loads in the lung and nasal turbinate (NT) of BNT162b2 vaccinated and unvaccinated C57BL/6 J WT/μMT mice at 2 d.p.i. and 4 d.p.i. (n = 6). d, e Representative images of the H&E-stained lung tissues of BNT162b2 vaccinated and unvaccinated C57BL/6 J WT/μMT mice challenged with Alpha (d) or Omicron BA.1 variant (e). Scale bar = 200 μm. Data are presented as mean ± SD. Statistical significance was calculated using one-way ANOVA test (*p < 0.05, **p < 0.01, ***p < 0.001, ****p < 0.0001, ns = not significant). Figure 2a was created with BioRender.com.
Fig. 3
Fig. 3. BNT162b2 stimulates substantially higher levels of cytokines/chemokines in C57BL/6 J μMT mice.
a Schematic diagram of vaccination, viral challenge, and multiplex cytokine/chemokine profiling. b Cytokine/chemokine profiles in blood samples collected from BNT162b2 vaccinated and unvaccinated C57BL/6 J WT/μMT mice at 2 d.p.i. of Alpha variant determined by multiplex profiling (For WT mice, n = 10; μMT mice, n = 12). c Schematic diagram of vaccination, viral challenge, and cytokine/chemokine measurement by q-RTPCR. di The IFN-γ, IP-10, and MCP-1 expression was determined by q-RTPCR using RNA samples extracted from lung and NT from BNT162b2 vaccinated and unvaccinated C57BL/6 J WT/μMT mice at 2 d.p.i. and 4 d.p.i. of Alpha (d, f, h) or Omicron BA.1 variant (e, g, i) (n = 6). Data are presented as mean ± SD. Statistical significance was calculated using one-way ANOVA test (*p < 0.05, **p < 0.01, ***p < 0.001, ****p < 0.0001, ns = not significant). Figure 3a, c were created with BioRender.com.
Fig. 4
Fig. 4. BNT162b2 also offers protection against SARS-CoV-2 in K18-hACE2 μMT mice.
a Schematic diagram of vaccination, viral challenge and cytokine/chemokine measurement, and pathological studies in K18-hACE2 model. b, c The viral loads in the lung and NT of BNT162b2 vaccinated and unvaccinated K18-hACE2 WT/μMT mice at 2 d.p.i. and 4 d.p.i. (n = 6). d, e Representative images of the H&E-stained lung tissues of BNT162b2 vaccinated and unvaccinated K18-hACE2 WT/μMT mice challenged with Alpha (d) or Omicron BA.1 variant (e). fk The IFN-γ, IP-10, and MCP-1 level was quantified by q-RTPCR using RNA samples extracted from lung and NT from BNT162b2 vaccinated and unvaccinated K18-hACE2 WT/μMT mice at 2 d.p.i. and 4 d.p.i. of Alpha (f, h, j) or Omicron BA.1 variant (g, i, k) (n = 6). Scale bar = 200 μm. Data are presented as mean ± SD. Statistical significance was calculated using one-way ANOVA test (*p < 0.05, **p < 0.01, ***p < 0.001, ****p < 0.0001, ns = not significant). Figure 4a was created with BioRender.com.
Fig. 5
Fig. 5. Transcriptome profiles of BNT162b2 vaccinated µMT mice after SARS-CoV-2 challenge are determined by bulk RNA-Seq.
a Schematic diagram of the experimental design of the RNA-seq. C57BL/6 J µMT and WT mice were either unvaccinated or vaccinated with BNT162b2 three weeks before SARS-CoV-2 Alpha challenge. NT and lung tissues were then collected 48 h after the challenge for further RNA-seq library construction and sequencing. b Heatmap plot showing Gene ontology and KEGG pathway where significantly differentially expressed genes are enriched. The colored block indicated genes enriched terms showed in the right with corresponding Benjamini-Hochberg adjusted P values. (UV: unvaccinated) c Volcano plot showing differential expression genes from DESeq2 comparing BNT162b2 vaccinated transcriptome to unvaccinated ones in both NT and lung tissues of µMT mice. Genes with orange labels were significantly upregulated in NT or lung (Benjamini-Hochberg adjusted P value < 0.05 and gene expression fold change > 2), scatters with grey labels indicated gene upregulated in both NT and lung (Benjamini-Hochberg adjusted P value < 0.05 and gene expression fold change > 2). d Heatmap plot showing the expression levels of upregulated genes labeled in (b) across different conditions, expression of each gene was scaled in NT and lung, respectively. Figure 5a was created with BioRender.com.
Fig. 6
Fig. 6. Vaccine-induced immunity in μMT mice is associated with elevated IFN-γ expression, CD4+ and CD8+ T cells.
a Schematic diagram of vaccination, IFN-γ depletion, viral challenge, and pathological studies. b The viral loads in the lung and NT of BNT162b2 vaccinated and unvaccinated C57BL/6 J μMT mice at 2 d.p.i. with IFN-γ depletion (n = 10). (mIFN-γ, anti-IFN-γ monoclonal antibody). c Representative images of the H&E-stained lung tissues of BNT162b2 vaccinated WT/μMT mice treated with mIFN-γ or PBS. Scale bar = 200 μm. d Schematic diagram of IFN-γ administration in naïve μMT mice upon Alpha challenge. e The viral loads in the lung and NT of naïve μMT mice supplemented with IFN-γ or PBS at 2 d.p.i. (n = 6). f Representative images of the H&E-stained lung tissues of naive μMT mice treated with IFN-γ or PBS. Scale bar = 200 μm. Data are presented as mean ± SD. Statistical significance was calculated using one-way ANOVA test or unpaired two-tailed Student’s t-test. (*p < 0.05, **p < 0.01, ***p < 0.001, ****p < 0.0001, ns = not significant). Figure 6a, d were created with BioRender.com.
Fig. 7
Fig. 7. CD4+ and CD8+ T cells are required for the vaccine-induced clearance of SARS-CoV-2 in NT and lung tissue in μMT mice.
a Schematic diagram of vaccination, CD4+ or CD8+ T cell depletion, viral challenge, and pathological studies. b The viral loads in the lung and NT of BNT162b2 vaccinated and unvaccinated C57BL/6 J μMT mice at 2 d.p.i. with CD4+, CD8+, or both T cell depletion (n = 10). (aCD4, anti-CD4 monoclonal antibody; aCD8, anti-CD8 monoclonal antibody). c Representative images of the H&E-stained lung tissues of BNT162b2 vaccinated μMT mice treated with aCD4, aCD8, both depleting antibodies or PBS. Scale bar = 200μm. d Schematic diagram of flow cytometry analysis of CD4+ and CD8+ T cells in lung tissues of vaccinated and unvaccinated C57BL/6 J μMT mice after Alpha infection. e Percentage of CXCR6+ and CD69+ CD4/8+ T cells in lung tissues of vaccinated and unvaccinated C57BL/6 J μMT mice after Alpha infection (n = 5). f Percentage of CD44+ IFN-γ+ CD4/8+ and CD44+ Granzyme B+ CD8+ T cells in lung tissues of vaccinated and unvaccinated C57BL/6 J μMT mice after Alpha infection (n = 5). g Representative dot plots showing IFN-γ- and Granzyme B-producing CD44+ CD4/8+ T cells in lung tissues of vaccinated and unvaccinated C57BL/6 J μMT mice after Alpha infection. Data are presented as mean ± SD. Statistical significance was calculated using one-way ANOVA test or unpaired two-tailed Student’s t-test (*p < 0.05, **p < 0.01, ***p < 0.001, ****p < 0.0001, ns = not significant). Figure 7a, d were created with BioRender.com.
Fig. 8
Fig. 8. BNT162b2 induces protective immunity in C57BL/6 J and K18-hACE2 μMT mice against Omicron BA.5.2.
a Schematic diagram of vaccination, viral challenge, and pathological studies in C57BL/6 J and K18-hACE2 model. b, c The viral loads in the lung and NT of BNT162b2 vaccinated/unvaccinated C57BL/6 J and K18-hACE2 WT/μMT mice at 2 d.p.i. and 4 d.p.i. (n = 6). d The viral loads in the lung and NT of naïve μMT mice supplemented with IFN-γ or PBS at 2 d.p.i. upon Omicron BA.5.2 infection (n = 6). e, f Representative images of the H&E-stained lung tissues of BNT162b2 vaccinated/unvaccinated C57BL/6 J (e) and K18-hACE2 (f) WT/μMT mice challenged with Omicron BA.5.2 Scale bar =  200  μm. g Representative images of the H&E-stained lung tissues of naive μMT mice treated with IFN-γ or PBS. Scale bar = 200 μm. Data are presented as mean ± SD. Statistical significance was calculated using one-way ANOVA test (*p < 0.05, **p < 0.01, ***p < 0.001, ****p < 0.0001, ns = not significant). Figure 8a was created with BioRender.com.

References

    1. Chodick G, et al. The effectiveness of the two-dose bnt162b2 vaccine: analysis of real-world data. Clin. Infect. Dis. 2022;74:472–478. doi: 10.1093/cid/ciab438. - DOI - PMC - PubMed
    1. Glatman-Freedman A, et al. Effectiveness of BNT162b2 vaccine in adolescents during outbreak of sars-cov-2 delta variant infection, Israel, 2021. Emerg. Infect. Dis. 2021;27:2919–2922. doi: 10.3201/eid2711.211886. - DOI - PMC - PubMed
    1. Tartof SY, et al. Effectiveness of mRNA BNT162b2 COVID-19 vaccine up to 6 months in a large integrated health system in the USA: a retrospective cohort study. Lancet. 2021;398:1407–1416. doi: 10.1016/S0140-6736(21)02183-8. - DOI - PMC - PubMed
    1. Apostolidis, S. A.-O. et al. Cellular and humoral immune responses following SARS-CoV-2 mRNA vaccination in patients with multiple sclerosis on anti-CD20 therapy. Nat. Med.27, 1990–2001 (2021). - PMC - PubMed
    1. Bitoun, S. A.-O. et al. Rituximab impairs b cell response but not t cell response to covid-19 vaccine in autoimmune diseases. Arthritis Rheumatol.74, 927–933 (2022). - PMC - PubMed

Publication types

Supplementary concepts