. 2023 Jun 10;7(1):57.
doi: 10.1038/s41698-023-00406-8.

Bayesian risk prediction model for colorectal cancer mortality through integration of clinicopathologic and genomic data

Affiliations

Bayesian risk prediction model for colorectal cancer mortality through integration of clinicopathologic and genomic data

Melissa Zhao et al. NPJ Precis Oncol. .

Abstract

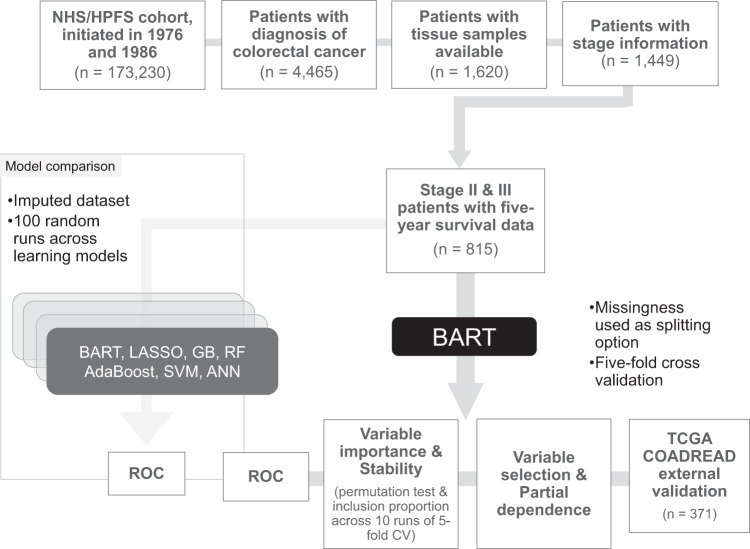
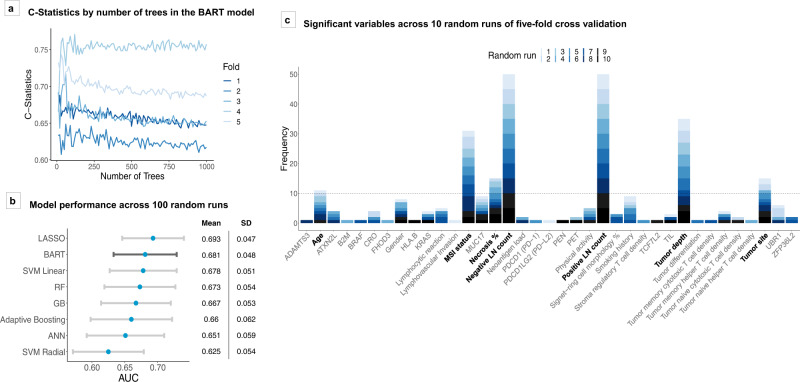
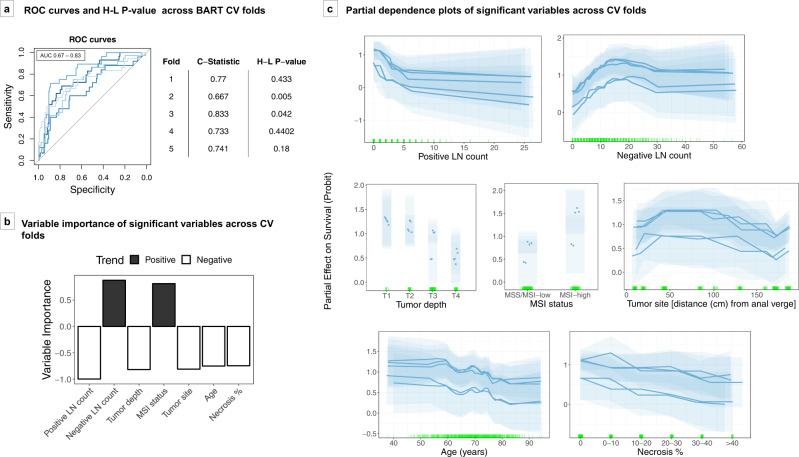
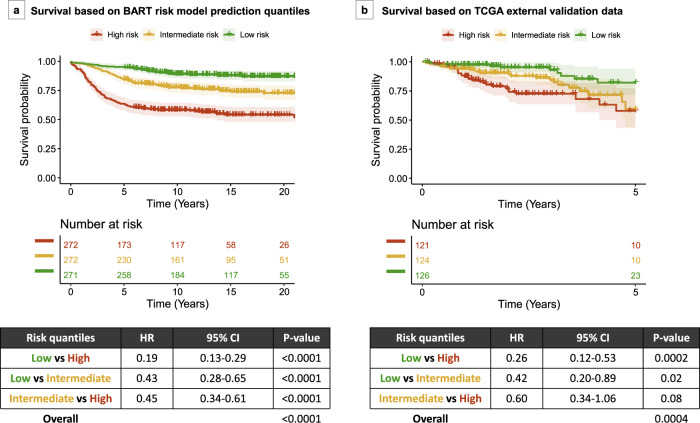
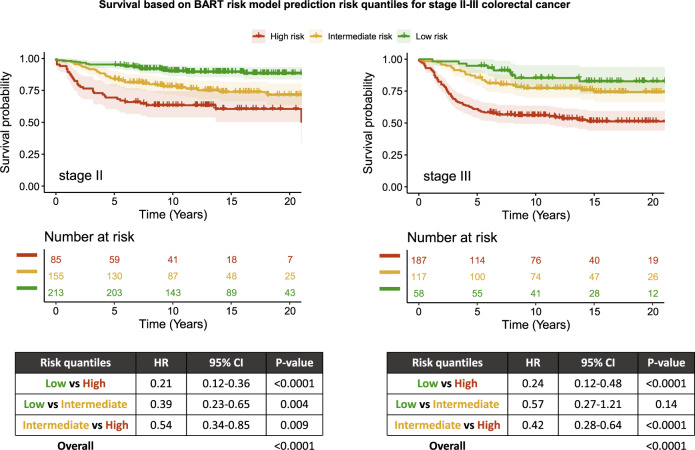
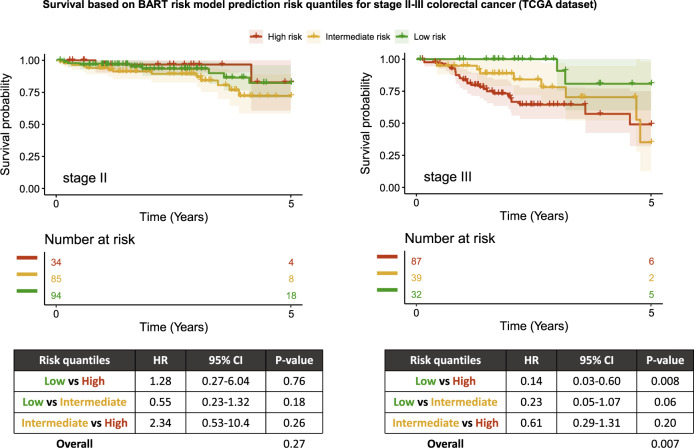
Routine tumor-node-metastasis (TNM) staging of colorectal cancer is imperfect in predicting survival due to tumor pathobiological heterogeneity and imprecise assessment of tumor spread. We leveraged Bayesian additive regression trees (BART), a statistical learning technique, to comprehensively analyze patient-specific tumor characteristics for the improvement of prognostic prediction. Of 75 clinicopathologic, immune, microbial, and genomic variables in 815 stage II-III patients within two U.S.-wide prospective cohort studies, the BART risk model identified seven stable survival predictors. Risk stratifications (low risk, intermediate risk, and high risk) based on model-predicted survival were statistically significant (hazard ratios 0.19-0.45, vs. higher risk; P < 0.0001) and could be externally validated using The Cancer Genome Atlas (TCGA) data (P = 0.0004). BART demonstrated model flexibility, interpretability, and comparable or superior performance to other machine-learning models. Integrated bioinformatic analyses using BART with tumor-specific factors can robustly stratify colorectal cancer patients into prognostic groups and be readily applied to clinical oncology practice.


Conflict of interest statement

A.T.C. previously served as a consultant for Bayer Healthcare and Pfizer Inc. M.G. receives research funding from Bristol-Myers Squibb, Merck, Servier and Janssen. C.S.F. is currently employed by Genentech / Roche and previously served as a consultant for Agios, Bain Capital, Bayer, Celgene, Dicerna, Five Prime Therapeutics, Gilead Sciences, Eli Lilly, Entrinsic Health, Genentech, KEW, Merck, Merrimack Pharmaceuticals, Pfizer Inc, Sanofi, Taiho, and Unum Therapeutics; C.S.F. also serves as a Director for CytomX Therapeutics and owns unexercised stock options for CytomX and Entrinsic Health. R.N. is currently employed by Pfizer Inc.; she contributed to this study before she became an employee of Pfizer Inc. J.A.M. has received institutional research funding from Boston Biomedical, has served as an advisor/consultant to Ignyta and COTA Healthcare, and served on a grant review panel for the National Comprehensive Cancer Network funded by Taiho Pharmaceutical. This study was not funded by any of these commercial entities. K.-H.Y. is an inventor of U.S. Patent 10,832,406 (not related to this study). This study was not funded by any of these companies. C.G. is, as of November 2022, a postdoctoral research scientist at Columbia University of New York City and a part-time bioinformatician at Watershed Informatics. No other conflicts of interest exist. The remaining authors declare no competing interests.

Figures

Fig. 1
Fig. 1. Overview of study.
External validation of the BART model was conducted using 106 of 371 stage II–III patients in TCGA dataset as 5-year overall survival information was missing in 265 patients. Overall survival analyses were conducted using all 371 patients with predicted probabilities of 5-year survival status based on the covariates. AdaBoost adaptive boosting, ANN artificial neural network, BART Bayesian additive regression trees, COADREAD colorectal adenocarcinoma, CV cross-validation, GB gradient boosting, HPFS Health Professionals Follow-up Study, LASSO least absolute shrinkage and selection operator, NHS Nurses’ Health Study, RF random forest, ROC receiver operating characteristics, SVM support vector machine, TCGA The Cancer Genome Atlas.
Fig. 2
Fig. 2. BART model characteristics and performance metrics.
a Model performances in terms of receiver operating characteristics (ROC) C-statistics for stage II–III 5-year survival models across fivefold cross-validation, with variable number of trees parameter. b Model performances across 100 random runs in terms of area under the ROC curve (AUC). Blue dots represent mean AUC values across the runs by model type. Gray bars represent the standard deviations of AUC values across runs. c Variable selection using BART at threshold of P = 0.05. Figure shows number of times variables were deemed significant across ten random runs. Variables that appeared an average of at least once per fivefold cross-validation were used for downstream analysis. ANN artificial neural network, AUC area under the ROC curve, BART Bayesian additive regression trees, CRO Crohn’s-like reaction, GB gradient boosting, LASSO least absolute shrinkage and selection operator, LNs lymph nodes, MSI microsatellite instability, PEN periglandular reaction, PET peritumoral reaction, RF random forest, ROC receiver operating characteristics, SD standard deviation, SVM support vector machine, TIL tumor-infiltrating lymphocytes.
Fig. 3
Fig. 3. BART stage II–III survival prediction model.
The BART prediction model was constructed based on seven significant and stable variables, namely positive and negative lymph node counts, depth of tumor invasion, microsatellite instability (MSI) status, tumor site, extraglandular necrosis, and age. a ROC curves and Hosmer–Lemeshow P values across fivefolds of cross-validation (CV). b Average variable importance across fivefolds of cross-validation, displayed in order of highest average importance. Black bars represent variables with positive trend with survival and white bars represent variables with negative trend with survival. c Partial dependence plots of significant variables across cross-validation folds. Each transparent block represents the 95% credible interval of one cross-validation fold based on 1000 posterior samples. Partial effects are plotted in terms of probability of survival on Probit scale. Darker lines and points represent the expected value of partial dependence for each variable across 1000 posterior samples. Green vertical hash marks on the X axis indicate observed data points used to generate the model. AUC area under the ROC curve, BART Bayesian additive regression trees, CV cross-validation, H-L Hosmer–Lemeshow, LNs lymph nodes, MSI microsatellite instability, MSS microsatellite stable, ROC receiver operating characteristics.
Fig. 4
Fig. 4. Kaplan–Meier plots for survival in patients with stage II/III colorectal cancer, based on risk quantiles from BART risk model.
a NHS/HPFS dataset survival based on risk quantiles. b TCGA external validation dataset survival based on risk quantiles. Tables show Cox proportional hazards models using risk quantiles and overall P values by log-rank test. BART Bayesian additive regression trees, CI confidence interval, HR hazard ratio.
Fig. 5
Fig. 5. Stage-specific Kaplan–Meier plots for survival.
Survival plots are shown for patients with stage II (left) and stage III (right) colorectal cancer, based on risk quantiles derived from predicted probabilities generated by the BART risk model. Table shows Cox proportional hazards model using risk quantiles and overall P value by log-rank test. BART Bayesian additive regression trees, CI confidence interval, HR hazard ratio.
Fig. 6
Fig. 6. Stage-specific Kaplan–Meier plots for survival in TCGA dataset.
Survival plots are shown for patients with stage II (left) and stage III (right) colorectal cancer in TCGA dataset, based on risk quantiles derived from predicted probabilities generated by the BART risk model. Table shows Cox proportional hazards model using risk quantiles and overall P value by log-rank test. BART Bayesian additive regression trees, CI confidence interval, HR hazard ratio.

References

    1. Inamura K, et al. Cancer as microenvironmental, systemic and environmental diseases: opportunity for transdisciplinary microbiomics science. Gut. 2022;71:2107–2122. doi: 10.1136/gutjnl-2022-327209. - DOI - PMC - PubMed
    1. Marshall JL, et al. Adjuvant therapy for stage II and III colon cancer: consensus report of the International Society of Gastrointestinal Oncology. Gastrointest. Cancer Res. 2007;1:146–154. - PMC - PubMed
    1. Taieb J, Gallois C. Adjuvant chemotherapy for stage III colon cancer. Cancers. 2020;12:2679. doi: 10.3390/cancers12092679. - DOI - PMC - PubMed
    1. Bai J, Chen H, Bai X. Relationship between microsatellite status and immune microenvironment of colorectal cancer and its application to diagnosis and treatment. J. Clin. Lab. Anal. 2021;35:e23810. doi: 10.1002/jcla.23810. - DOI - PMC - PubMed
    1. Mima K, et al. Fusobacterium nucleatum in colorectal carcinoma tissue and patient prognosis. Gut. 2016;65:1973–1980. doi: 10.1136/gutjnl-2015-310101. - DOI - PMC - PubMed