. 2023 Jun 10;21(1):377.
doi: 10.1186/s12967-023-04149-9.

Plasma proteome of Long-COVID patients indicates HIF-mediated vasculo-proliferative disease with impact on brain and heart function

Affiliations

Plasma proteome of Long-COVID patients indicates HIF-mediated vasculo-proliferative disease with impact on brain and heart function

Cristiana Iosef et al. J Transl Med. .

Abstract

Aims: Long-COVID occurs after SARS-CoV-2 infection and results in diverse, prolonged symptoms. The present study aimed to unveil potential mechanisms, and to inform prognosis and treatment.

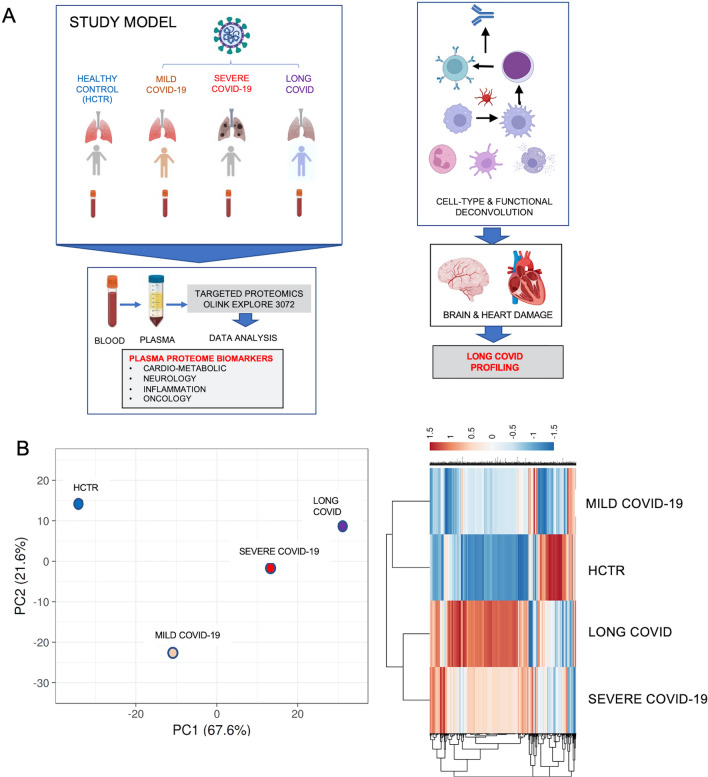
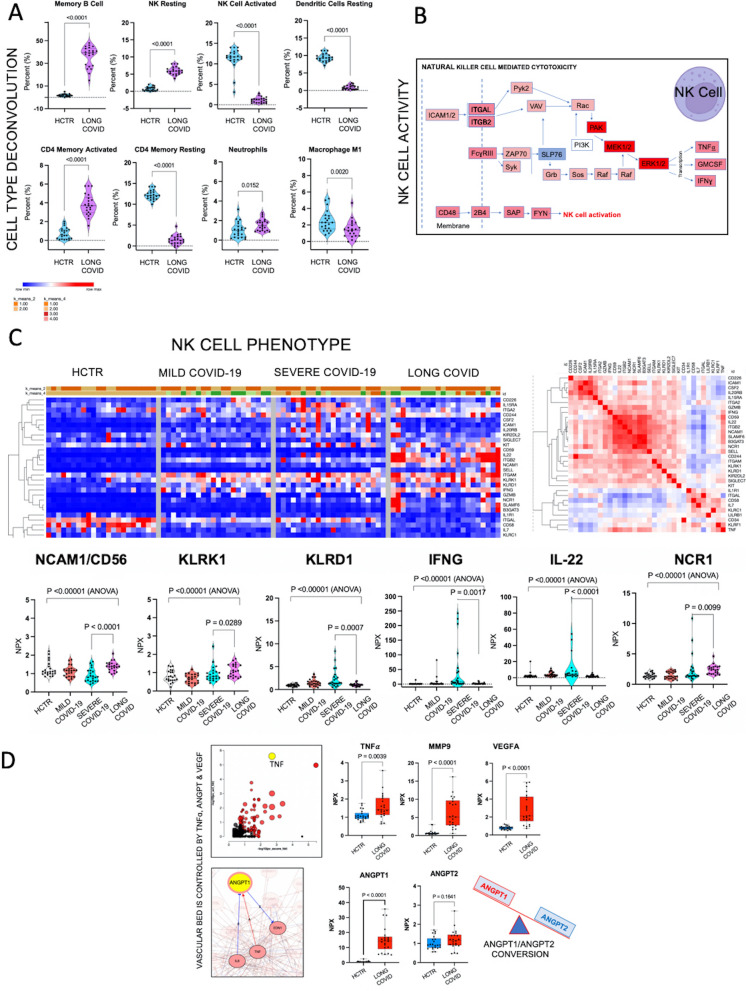
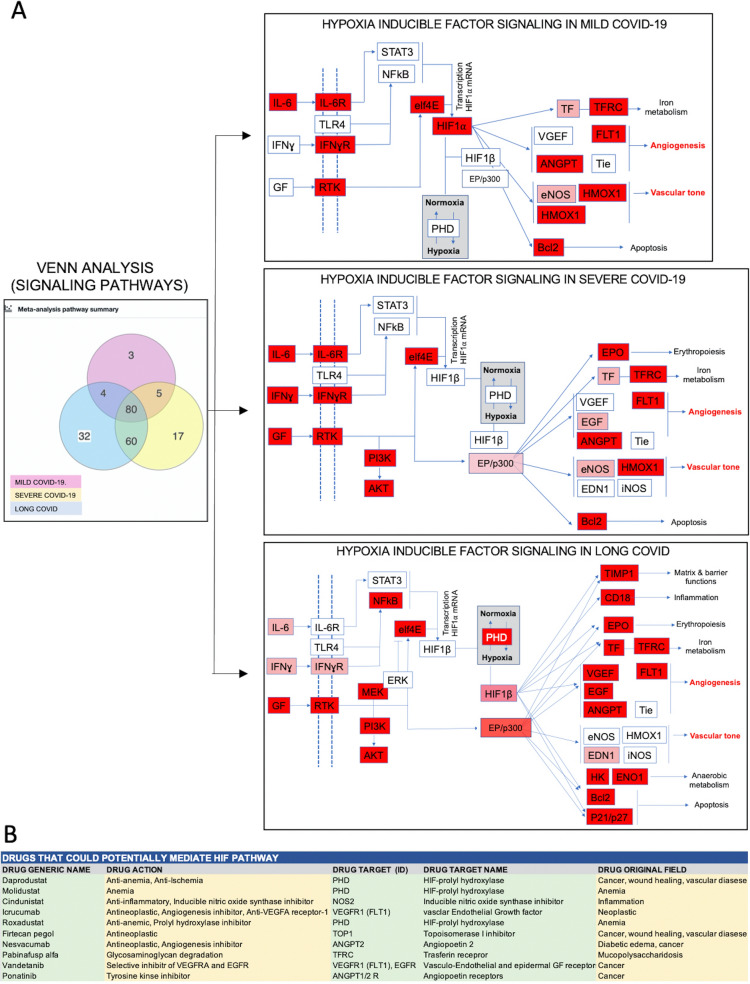
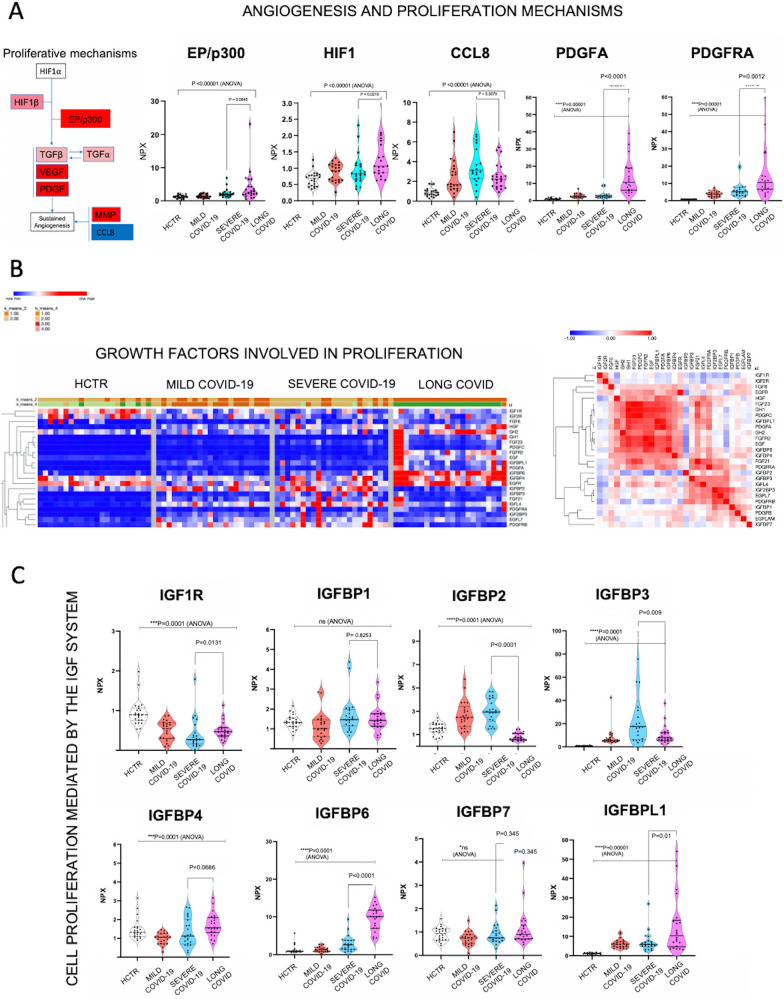
Methods: Plasma proteome from Long-COVID outpatients was analyzed in comparison to matched acutely ill COVID-19 (mild and severe) inpatients and healthy control subjects. The expression of 3072 protein biomarkers was determined with proximity extension assays and then deconvoluted with multiple bioinformatics tools into both cell types and signaling mechanisms, as well as organ specificity.

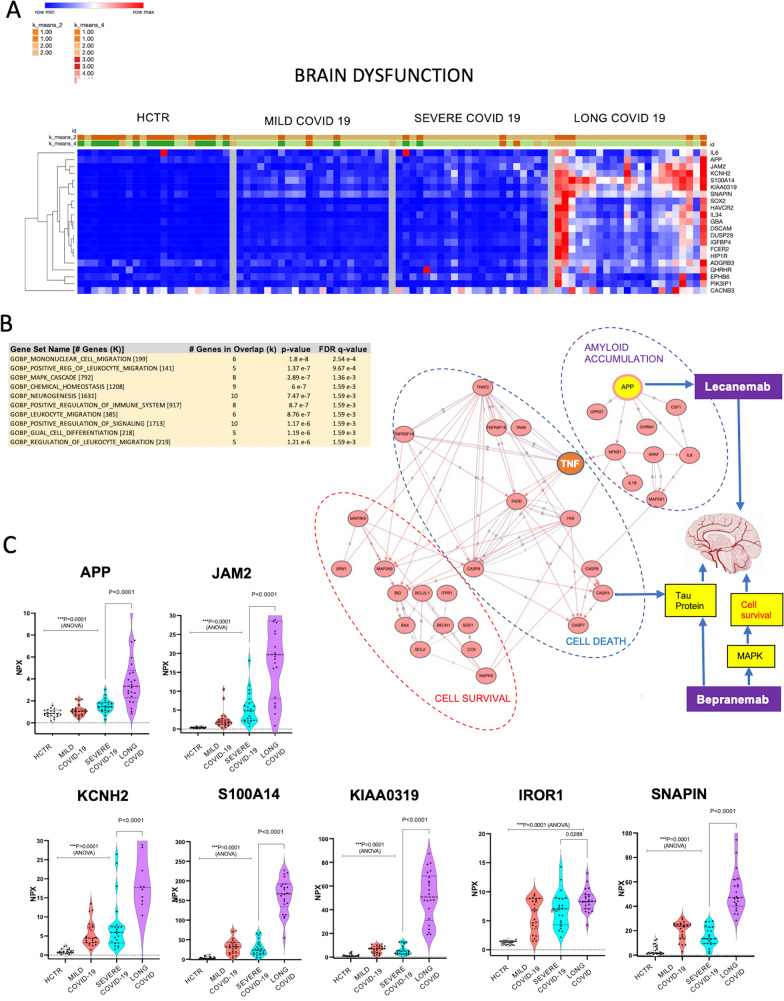
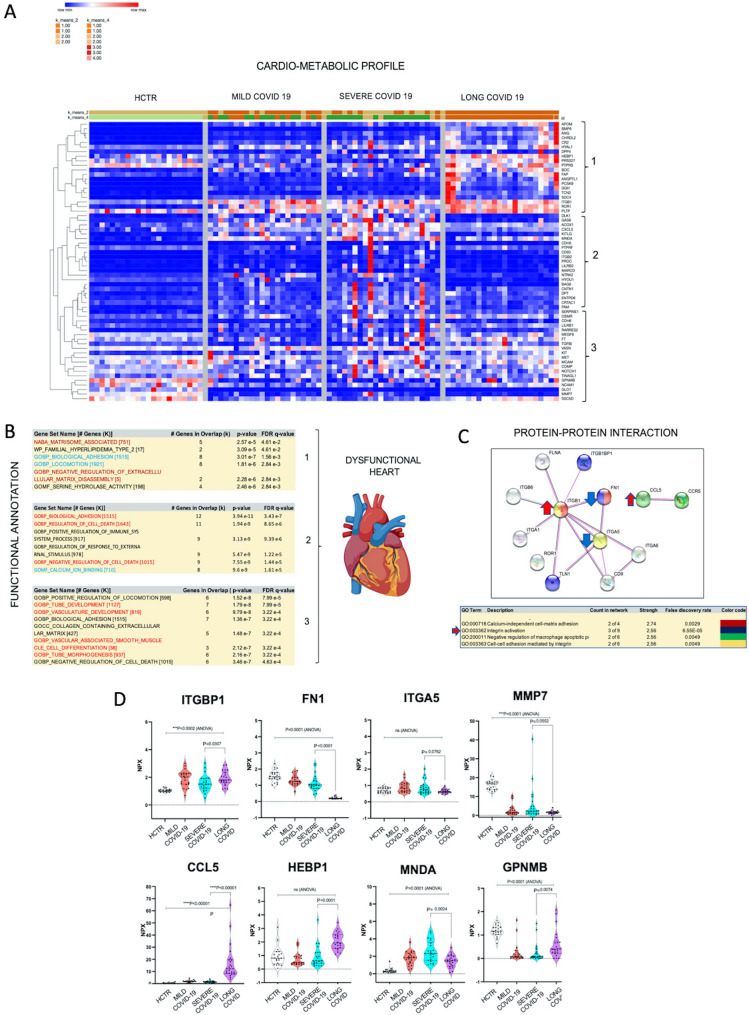
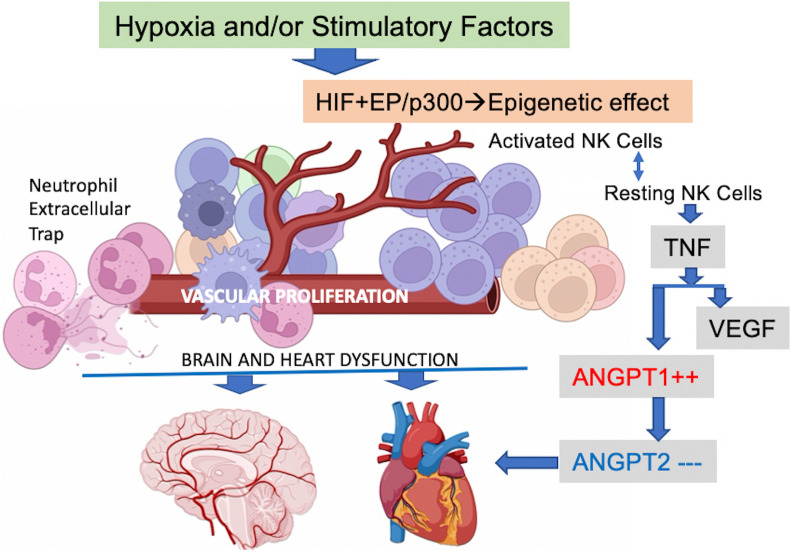
Results: Compared to age- and sex-matched acutely ill COVID-19 inpatients and healthy control subjects, Long-COVID outpatients showed natural killer cell redistribution with a dominant resting phenotype, as opposed to active, and neutrophils that formed extracellular traps. This potential resetting of cell phenotypes was reflected in prospective vascular events mediated by both angiopoietin-1 (ANGPT1) and vascular-endothelial growth factor-A (VEGFA). Several markers (ANGPT1, VEGFA, CCR7, CD56, citrullinated histone 3, elastase) were validated by serological methods in additional patient cohorts. Signaling of transforming growth factor-β1 with probable connections to elevated EP/p300 suggested vascular inflammation and tumor necrosis factor-α driven pathways. In addition, a vascular proliferative state associated with hypoxia inducible factor 1 pathway suggested progression from acute COVID-19 to Long-COVID. The vasculo-proliferative process predicted in Long-COVID might contribute to changes in the organ-specific proteome reflective of neurologic and cardiometabolic dysfunction.

Conclusions: Taken together, our findings point to a vasculo-proliferative process in Long-COVID that is likely initiated either prior hypoxia (localized or systemic) and/or stimulatory factors (i.e., cytokines, chemokines, growth factors, angiotensin, etc). Analyses of the plasma proteome, used as a surrogate for cellular signaling, unveiled potential organ-specific prognostic biomarkers and therapeutic targets.


Conflict of interest statement

There are no competing interests.

Figures

Fig. 1
Fig. 1
Study model and dimensionality reduction of data sets. A Model in the left panel illustrates four study cohorts, including Long-COVID, severe COVID-19, mild COVID-19, and healthy control subjects. The plasma proteome obtained by Proximity Extension Assay (PEA), with the expression of 3072 plasma proteins measured. Right panel informs on the type of data processing strategy targeting cell and organ typing. B Principal component analysis and hierarchical clustering. Unit variance scaling was applied to rows; SVD with imputation is used to calculate principal components. X and Y axis show principal component 1 and principal component 2 which explain PC1 (67.6%) and PC2 (21.6%) of the total variance, respectively (N = 4 data points, the means of the values given by all patients within a group). Data was processed by Clustvis software
Fig. 2
Fig. 2
Natural killer (NK) cells change phenotypes in Long-COVID from activated to resting. A General immune cell typing using CIBERSORT analysis tool. The algorithms were applied to plasma proteome data sets after proteins were converted into genes. Graphs show the proportional contribution of each cell type in plasma for Long-COVID outpatients compared to healthy control subjects (HCTR). B Diagram depicts the NK cell cytotoxic pathways, a segment of KEGG pathways through iPathways Guide platform. Up-regulated biomarkers are shown in red and down-regulated in blue. Red arrows indicate  direct interactions. Analysis was done with KEGG Mapper, also confirmed by iPathwayGuide. C Heatmaps represent the profiling of the NK cell phenotype. Left heatmap shows the hierarchical clustering of NK cell hand curated markers and in the right panel the similarity test based on Pearson Correlation. For data visualization we used Morpheus software from Broad Institute. Graphs emphasize  individual NK cell markers expression in plasma compared among study groups. Statistical significance was processed with GraphPad 9, P-value was considered significant if < 0.05 in either ANOVA (group), or Mann–Whitney U test. D Left graph represents pathways analysis scoring done with iPathwaysGuide software; tumor necrosis factor (TNF) signaling was the highest hit; schematic below represents the main predicted molecular interactions of ANGPT1 according to STRING analysis and confirmed by iPathwayGuide. Graphs shows the TNF expression in plasma as detected by PEA. The rest of the graphs indicate the plasma expression levels of Angiopoietin 1 (ANGPT1), Matrix metalloproteinase 9 (MMP9) and Vasculo- Endothelial Growth Factor A (VEGFA); all these proteins are predicted to be induced and potentiated by TNF. Statistical significance was processed with GraphPad 9, P-value was considered significant if < 0.05 with Mann–Whitney U test
Fig. 3
Fig. 3
Neutrophil extracellular trap formation has a critical role in Long-COVID. A Diagram shows the NK cell cytotoxic pathways mapped on KEGG charts via iPathwayGuide platform. Up-regulated biomarkers are shown in red (KEGG Mapper, also confirmed by iPathwayGuide software). Graphs display the levels of individual NK-cell marker expression in plasma among the study cohorts. Statistical significance was determined with GraphPad 9, P-value was considered significant if < 0.05 with an ANOVA. B Heatmaps represent the profiling of the neutrophil cell phenotype. Markers have been manually curated. In the left panel, heatmap shows the hierarchical clustering of all markers and in the right panel the similarity matrix based on Pearson correlation. For data visualization we used Morpheus software from Broad Institute. C Graphs show individual neutrophil cell markers expression in plasma; comparison among all study cohorts. Statistical significance was processed with GraphPad 9, P-value was considered significant if < 0.05 with ANOVA
Fig. 4
Fig. 4
Increased expression of EP/p300 may repurpose TNF actions in Long-COVID. A Diagram shows TGFβ signaling pathways. Up-regulated biomarkers are shown in red and down-regulated in blue (KEGG Mapper, confirmed by iPathwayGuide software). B Graphs represent the expression levels of markers associated with the TGFβ1 pathway. Statistical significance was established using GraphPad-9, and P-value was considered significant if < 0.05 with Mann–Whitney U test. Key protein interactions are presented in the diagram from the middle panel (right side), an output of STRING confirmed with iPathwayGuide software. Fluctuation of the TGFβ and TNFα may impact EP/p300 epigenetic activity
Fig. 5
Fig. 5
COVID-19 associated hypoxia is potentially mediated by HIF-1 and EP/p300, possibly disrupting the vascular bed. Long-COVID data has been intersected with Mild and Severe COVID-19 data sets, each normalized to the healthy control group (meta-analysis was performed with KEGG Mapper and confirmed by iPathwaysGuide software). Venn diagram at the left shows the intersection of the total number of signaling pathways among the clinical groups (iPathwayGuide). A One of the pathways predicted to support vasculo-proliferative disease was HIF-1-signaling pathway. Diagrams represent sequences of the HIF-1 pathways mapped onto KEGG charts and analyzed by iPathwayGuide software. The configuration of this pathway evolved from Mild COVID-19 to Severe COVID-19, having the most prominent representation in Long-COVID. Note: vasculo-proliferative disease is regularly mediated by HIF, which increases both proliferation and angiogenesis. B Table shows the drugs associated with the HIF pathway which can be repurposed for Long-COVID therapeutics (drug Bank output)
Fig. 6
Fig. 6
Long-COVID is associated with abnormal proliferation pathways, largely affecting the vascular bed. A Diagram at the left shows a sequence of proliferative signaling pathways mapped on KEGG charts (KEGG Mapper). The top right panel presents graphs depicting the expression of individual markers that belong to the proliferative pathways mediated by VEGF. Comparison has been done among all study groups and statistical significance was established using GraphPad-9, with P-value considered significant if < 0.05 with ANOVA. B Heatmaps reflect global expression levels of the growth-factors that could be responsible for the cell proliferation via receptor tyrosine kinases (RTKs) membrane receptors. Markers have been manually curated based on literature reports. In the left panel heatmap shows the hierarchical clustering of all markers and in the right panel the similarity matrix based on Pearson Correlation. For data visualization we used Morpheus software from Broad Institute. C Graphs measure the levels of the insulin-like growth factor system (IGF), molecules known to regulate angiogenesis but also to ensure the sustainability of the vascular network. Statistical significance was established using GraphPad-9, and P-value was considered significant if < 0.05 with ANOVA
Fig. 7
Fig. 7
Long-COVID could impact brain functionality through vasculo-proliferative events possibly hosted by the blood–brain barrier. A Heatmaps reflect the levels of the most significant neurological markers per OLINK panels I, II and III, which were largely changed in Long-COVID patient plasma. Values were hierarchically clustered based on Pearson correlation algorithms. For data visualization we used Morpheus software, a tool designed by the Broad Institute. B Table shows functional annotation terms obtained with tools from the Gene Set Enrichment Analysis (GSEA) platform. These clusters refer to leucocyte migration, positive immune signals, glial cell differentiation, neurogenesis and MAPK regulatory pathways. At the right, diagram shows a segment of brain degeneration pathways as described by KEGG charts and processed for protein–protein interaction capacities with STRING software (confirmed by iPathwayGuide). TNF and APP proteins are highlighted as major players. The latter finding suggests that Lecanemab, a humanized IgG1 monoclonal antibody that targets amyloid beta, could be considered as a disease modifying immunotherapy. According to KEGG encyclopedia (target-based classification of drugs chapter), Bepranemab is a humanized, monoclonal antibody that binds to the central region of the Tau protein whose primary role is maintenance of the microtubules in neuronal axons. Bepranemab affects three target pathways in the brain: i) Neurodegeneration, ii) Alzheimer Disease, and MAPK pathways related to cell survival. Taken together, this data is indirectly pointing to a possible blood brain barrier dysfunctionality based on cell proliferation. C The expression levels of markers from the above functional groups have been plotted on graphs, where comparison has been done among all study groups. P-value was considered significant if < 0.05 with ANOVA. One highly expressed biomarker marker was the Amyloid Precursor Protein (APP/Presenilin) that is mainly known as a pathognomonic marker for Alzheimer disease and/or brain inflammation
Fig. 8
Fig. 8
Long-COVID is potentially associated with cardiometabolic damage caused by vasculo-proliferative events. A Heatmaps reflect the levels of the most significant cardio-metabolic markers (per OLINK panels I and II) that were changed in Long-COVID patients. Markers have been curated by OLINK. Values have been hierarchically clustered based on Person correlation algorithms. For data visualization we used Morpheus software, a tool designed by the Broad Institute. B Post-hierarchical analysis these markers formed three functional clusters (#1, 2 and 3) determined with tools from the GSEA platform. These clusters refer to extracellular matrix remodeling, cell adhesion and motility, and angiogenesis (possible tube formation). C Markers forming the three functional clusters were analyzed for protein–protein interaction using STRING software (Search Tool for the Retrieval of Interacting Genes/Proteins). This analysis shows that extracellular matrix remodeling is dominated by integrin interactions and calcium binding events, as well as dysregulated macrophage activity (also observed by CIBERSORT analysis). D The expression levels of the markers that interact directly was plotted on graphs, where comparison has been done among all patient cohorts and statistical significance was determined by GraphPad-9 (P-value was considered significant if < 0.05 with ANOVA)
Fig. 9
Fig. 9
Schematic summary of the Long-COVID pathology as reflected in plasma proteome

References

    1. Castanares-Zapatero D, Chalon P, Kohn L, Dauvrin M, Detollenaere J, et al. Pathophysiology and mechanism of Long-COVID: a comprehensive review. Ann Med. 2022;54(1):1473–1487. doi: 10.1080/07853890.2022.2076901. - DOI - PMC - PubMed
    1. Brown K, Yahyouche A, Haroon S, Camaradou J, Turner J. Long-COVID and self-management. Lancet. 2022;22(399):10322–10355. - PMC - PubMed
    1. World Health Organization WHO R&D Blueprint. Novel Coronavirus. COVID-19 Therapeutic Trial Synopsis.https://cdn.who.int/media/docs/default-source/blue-print/covid-19-therap....
    1. Patel MA, Knauer MJ, Nicholson M, Daley M, Van Nynatten LR, Martin C, et al. Elevated vascular transformation blood biomarkers in long-COVID indicate angiogenesis as a key pathophysiological mechanism. Molec Med. 2022;28(1):122. doi: 10.1186/s10020-022-00548-8. - DOI - PMC - PubMed
    1. Patel MA, Knauer MJ, Nicholson M, Daley M, Van Nynatten LR, Cepinskas G, Fraser DD. Organ and cell-specific biomarkers of Long-COVID identified with targeted proteomics and machine learning. Mol Med. 2023;29(1):26. doi: 10.1186/s10020-023-00610-z. - DOI - PMC - PubMed

Publication types