

Meteorological data source comparison-a case study in geospatial modeling of potential environmental exposure to abandoned uranium mine sites in the Navajo Nation
- PMID: 37303005
- PMCID: PMC10258180
- DOI: 10.1007/s10661-023-11283-w
Meteorological data source comparison-a case study in geospatial modeling of potential environmental exposure to abandoned uranium mine sites in the Navajo Nation
Abstract
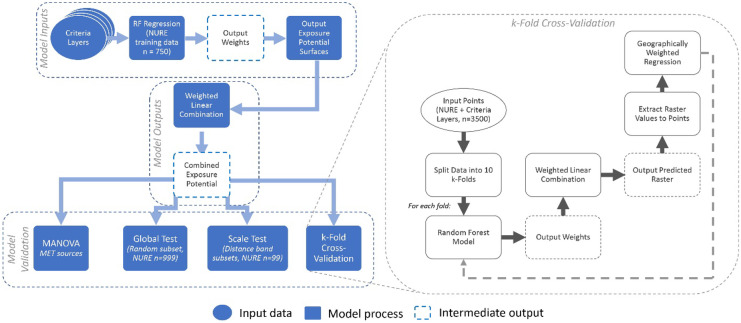
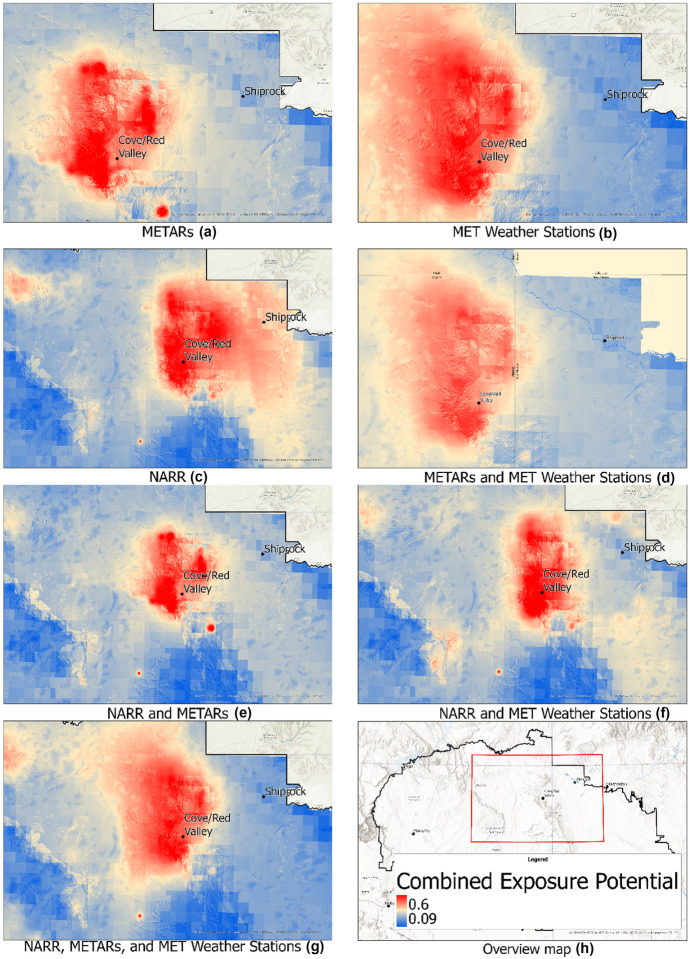
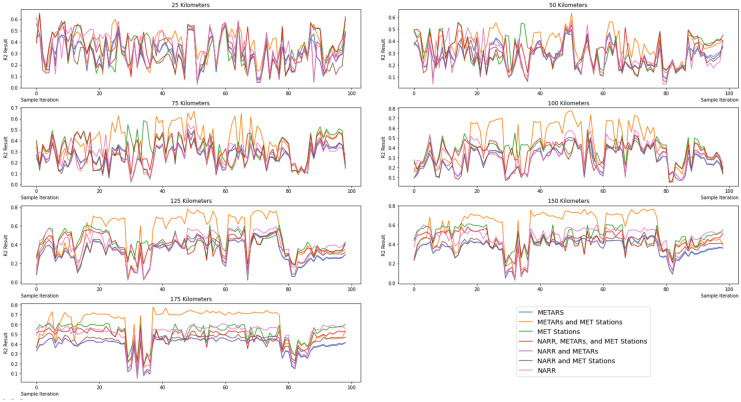
Meteorological (MET) data is a crucial input for environmental exposure models. While modeling exposure potential using geospatial technology is a common practice, existing studies infrequently evaluate the impact of input MET data on the level of uncertainty on output results. The objective of this study is to determine the effect of various MET data sources on the potential exposure susceptibility predictions. Three sources of wind data are compared: The North American Regional Reanalysis (NARR) database, meteorological aerodrome reports (METARs) from regional airports, and data from local MET weather stations. These data sources are used as inputs into a machine learning (ML) driven GIS Multi-Criteria Decision Analysis (GIS-MCDA) geospatial model to predict potential exposure to abandoned uranium mine sites in the Navajo Nation. Results indicate significant variations in results derived from different wind data sources. After validating the results from each source using the National Uranium Resource Evaluation (NURE) database in a geographically weighted regression (GWR), METARs data combined with the local MET weather station data showed the highest accuracy, with an average R2 of 0.74. We conclude that local direct measurement-based data (METARs and MET data) produce a more accurate prediction than the other sources evaluated in the study. This study has the potential to inform future data collection methods, leading to more accurate predictions and better-informed policy decisions surrounding environmental exposure susceptibility and risk assessment.
Keywords: Abandoned uranium mines; GIS multi-criteria decision analysis; Meteorological; Navajo nation; Particulate matter; Radom forest; Spatial analysis and modeling.
© 2023. The Author(s).
Conflict of interest statement
The authors declare no competing interests.
Figures


Similar articles
-
Environmental risk mapping of potential abandoned uranium mine contamination on the Navajo Nation, USA, using a GIS-based multi-criteria decision analysis approach.Environ Sci Pollut Res Int. 2020 Aug;27(24):30542-30557. doi: 10.1007/s11356-020-09257-3. Epub 2020 May 28. Environ Sci Pollut Res Int. 2020. PMID: 32468361 Free PMC article.
-
Elevated Arsenic and Uranium Concentrations in Unregulated Water Sources on the Navajo Nation, USA.Expo Health. 2017;9(2):113-124. doi: 10.1007/s12403-016-0226-6. Epub 2016 Aug 23. Expo Health. 2017. PMID: 28553666 Free PMC article.
-
Metal mixture exposures and multiplexed autoantibody screening in Navajo communities exposed to uranium mine wastes.J Transl Autoimmun. 2023 Apr 19;6:100201. doi: 10.1016/j.jtauto.2023.100201. eCollection 2023. J Transl Autoimmun. 2023. PMID: 37169001 Free PMC article.
-
Health Effects and Environmental Justice Concerns of Exposure to Uranium in Drinking Water.Curr Environ Health Rep. 2016 Dec;3(4):434-442. doi: 10.1007/s40572-016-0114-z. Curr Environ Health Rep. 2016. PMID: 27815781 Review.
-
Uranium mining in Portugal: a review of the environmental legacies of the largest mines and environmental and human health impacts.Environ Geochem Health. 2014 Apr;36(2):285-301. doi: 10.1007/s10653-013-9563-6. Epub 2013 Sep 13. Environ Geochem Health. 2014. PMID: 24030454 Review.
Cited by
-
Uranium accumulation in environmentally relevant microplastics and agricultural soil at acidic and circumneutral pH.Sci Total Environ. 2024 May 20;926:171834. doi: 10.1016/j.scitotenv.2024.171834. Epub 2024 Mar 21. Sci Total Environ. 2024. PMID: 38521258 Free PMC article.
References
-
- Bandyopadhyay A, Grace Nengzouzam W, Singh R, Hangsing N, Bhadra A. Comparison of various re-analyses gridded data with observed data from meteorological stations over India. EPiC Series in Engineering. 2018;3:190–198. doi: 10.29007/c1sf. - DOI
-
- Begay J, Sanchez B, Wheeler A, Baldwin F, Lucas S, Herbert G, Suarez YO, et al. Assessment of particulate matter toxicity and physicochemistry at the Claim 28 uranium mine site in Blue Gap, AZ. Journal of Toxicology and Environmental Health, Part A. 2021;84(1):31–48. doi: 10.1080/15287394.2020.1830210. - DOI - PMC - PubMed
-
- Belcher CM, Mander L, Rein G, Jervis FX, Haworth M, Hesselbo SP, Glasspool IJ, McElwain JC. Increased fire activity at the Triassic/Jurassic boundary in Greenland due to climate-driven floral change. Nature Geoscience. 2010;3(6):426–429. doi: 10.1038/ngeo871. - DOI
MeSH terms
Substances
Grants and funding
LinkOut - more resources
Full Text Sources
Miscellaneous
